This SysML diagram example was redesigned from Wikimedia Commons file: Use case restaurant model.svg.
"Use case model of a restaurant business." [commons.wikimedia.org/ wiki/ File:Use_ case_ restaurant_ model.svg]
"The use case diagram describes the usage of a system (subject) by its actors (environment) to achieve a goal, that is
realized by the subject providing a set of services to selected actors. The use case can also be viewed as functionality and/
or capabilities that are accomplished through the interaction between the subject and its actors. Use case diagrams include the use case and actors and the associated communications between them. Actors represent classifier roles that are external to the system that may correspond to users, systems, and or other environmental entities. They may interact either directly or indirectly with the system. The actors are often specialized to represent a taxonomy of user types or external systems." [omg.org/ spec/ SysML/ 1.3/ ]
The SysML diagram example "Use case restaurant model" was drawn using the ConceptDraw PRO diagramming and vector drawing software extended with the SysML solution from the Software Development area of ConceptDraw Solution Park.
HelpDesk
Accounting Information Systems Flowchart Symbols
Accounting Information system is a combination of software and hardware, as well as organizational support. Information system - it is not only the software and computers with network equipment, but also a list of instructions and standards which can be notated using Accounting information systems flowchart symbols. All information systems can be divided into information retrieval and data processing systems. Data Flow model is a hierarchical model. Each process can be divided into structural components, that depict by corresponding flowchart symbols, showing the accounting information system in communication with the external environment. The major components of accounting information systems flowchart are: entities, processes, data stores, and data flows. The set of standard accounting information flowchart symbols is intended to show the relationships between the system components. ConceptDraw PRO can help to draw clear accounting information system diagrams using special flowchart symbols.
 Entity-Relationship Diagram (ERD)
Entity-Relationship Diagram (ERD) solution extends ConceptDraw PRO software with templates, samples and libraries of vector stencils from drawing the ER-diagrams by Chen's and crow’s foot notations.
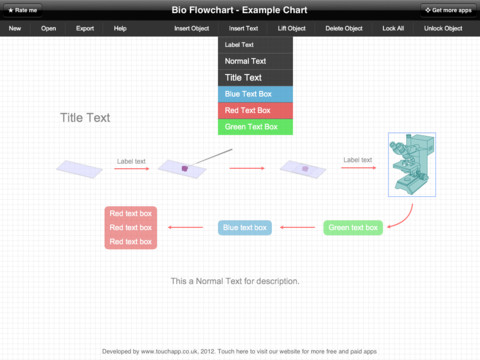
Bio Flowchart
This app targets to help teachers and students to create vivid and professional biological flowcharts and diagrams in an easy way.- Er Diagram For Restaurant Management System Pdf
- Entity Relationship Diagram Restaurant Management System Pdf File
- Er Diagram For Restaurant Management System Ppt
- Er Diagram Of Restaurant Management System
- Entity Relationship Diagram Restaurant Management System
- Er Representation Of Restaurant Management System
- Er Diagram Of Online Restaurant Management System
- Draw An Er Diagram For Restaurant Management System
- Office Layout Plans | Cafe and Restaurant Floor Plans | Entity ...
- Er Diagram For Online Restaurant Management System
- Er Diagram Of Restaurant Management System Download
- Er Digram Of Restaurant Food Ordering System
- Entity Relationship Diagram Software for Mac | Jacobson Use Cases ...
- Simple Entity Relationship Diagram Of A Restaurant
- Restaurant System
- Entity -Relationship Diagram (ERD) | Entity Relationship Diagram ...
- Er Diagram For Online Restaurant
- Entity Relationship Diagram Software for Mac | Developing Entity ...
- Martin ERD Diagram | ERD Symbols and Meanings | Entity ...
- How To Create Restaurant Floor Plan in Minutes | Entity ...


