 Entity-Relationship Diagram (ERD)
Entity-Relationship Diagram (ERD) solution extends ConceptDraw PRO software with templates, samples and libraries of vector stencils from drawing the ER-diagrams by Chen's and crow’s foot notations.
 Entity-Relationship Diagram (ERD)
An Entity-Relationship Diagram (ERD) is a visual presentation of entities and relationships. That type of diagrams is often used in the semi-structured or unstructured data in databases and information systems. At first glance ERD is similar to a flowch
HelpDesk
How to Create an ERD Diagram
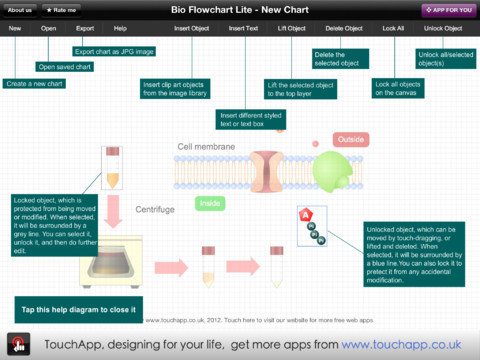
ERD (entity relationship diagram) is used to show the logical structure of databases. It represents the interrelationships between components of database (entities). Entity relationship diagrams are a widely used in software engineering. Using ERD software engineers can control the every aspect of database development. ER diagram can be used as guide for testing and communicating before the release of software product. ERD displays data as entities that are connected with connections that show the relationships between entities. There is some ERD notations used by data bases developers for representing the relationships between the data objects. ConceptDraw PRO and its ERD solution allow you to build ERD diagram of any notation.Bio Flowchart Lite
This app targets to help teachers and students to create vivid and professional biological flowcharts and diagrams in an easy way.HelpDesk
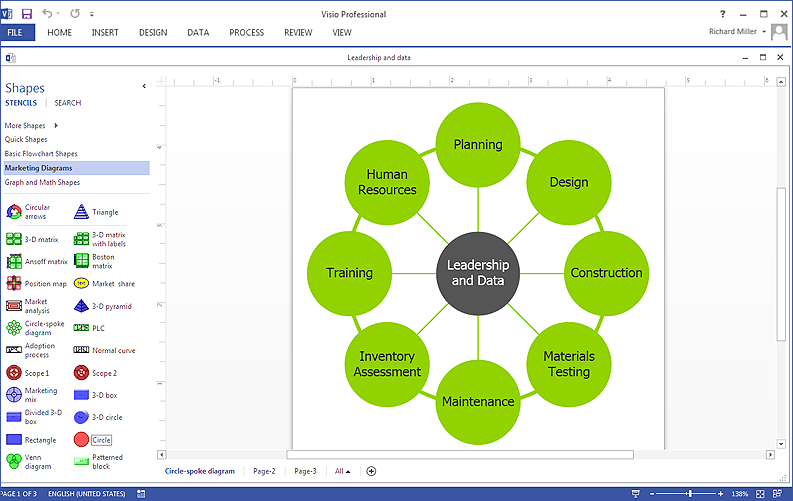
How To Create a Visio Circle-Spoke Diagram Using ConceptDraw PRO
Circle Spoke Diagram consists from a central round balloon , wich is circled with other balloons as a ring . The Circle Spoke Diagram is usually used in marketing . It shows the relationships of entities and the central element. Circle Spoke Diagram can be used in marketing documentation and presentations. ConceptDraw PRO allows you to easily create marketing charts of any complexity, including the circle-spoke diagram and then make a MS Visio file from your diagram in a few simple steps. You can easily design your business documentation and share it easily with MS Visio users.HelpDesk
Accounting Information Systems Flowchart Symbols
Accounting Information system is a combination of software and hardware, as well as organizational support. Information system - it is not only the software and computers with network equipment, but also a list of instructions and standards which can be notated using Accounting information systems flowchart symbols. All information systems can be divided into information retrieval and data processing systems. Data Flow model is a hierarchical model. Each process can be divided into structural components, that depict by corresponding flowchart symbols, showing the accounting information system in communication with the external environment. The major components of accounting information systems flowchart are: entities, processes, data stores, and data flows. The set of standard accounting information flowchart symbols is intended to show the relationships between the system components. ConceptDraw PRO can help to draw clear accounting information system diagrams using special flowchart symbols.- Entity - Relationship Diagram (ERD) | Marketing Area | Marketing ...
- Process Flowchart | Entity - Relationship Diagram (ERD) | Flow chart ...
- Entity - Relationship Diagram (ERD) | Process Flowchart | Venn ...
- Venn diagram - Relationship marketing
- Venn diagram - Relationship marketing | Block diagram - Six ...
- Venn Diagram | Venn Diagrams | Entity - Relationship Diagram (ERD ...
- Relationship Marketing Examples
- Diagram Of Relationship Marketing
- Venn Diagrams | Venn Diagram | Entity - Relationship Diagram (ERD ...
- Relationship Marketing
- Entity Relationship Model Of A Marketing Company
- ConceptDraw PRO ER Diagram Tool | Customer Relationship ...
- Entity - Relationship Diagram (ERD) | Marketing | ConceptDraw ...
- Pyramid Diagram and Pyramid Chart | Marketing Diagrams | Entity ...
- Entity - Relationship Diagram (ERD) | Entity - Relationship Diagram ...
- Entity Relationship Diagram Software Engineering
- Entity - Relationship Diagram (ERD)
- Application development - IDEF0 diagram | Software Diagrams ...
- Circle-Spoke Diagrams | Entity Relationship Diagram - ERD ...
- Entity - Relationship Diagram (ERD) | Entity - Relationship Diagram ...


