Data structure diagram with ConceptDraw PRO
Data structure diagram (DSD) is intended for description of conceptual models of data (concepts and connections between them) in the graphic format for more obviousness. Data structure diagram includes entities description, connections between them and obligatory conditions and requirements which connect them. Create Data structure diagram with ConceptDraw PRO.
 ConceptDraw Solution Park
ConceptDraw Solution Park collects graphic extensions, examples and learning materials
 Accounting Flowcharts
Accounting Flowcharts solution extends ConceptDraw PRO software with templates, samples and library of vector stencils for drawing the accounting flow charts.
HelpDesk
How to Create a Timeline Diagram in ConceptDraw PRO
A Timeline is a chart which displays a project plan schedule in chronological order. A Timeline is used in project management to depict project milestones and visualize project phases, and show project progress. The graphic form of a timeline makes it easy to understand critical project milestones, such as the progress of a project schedule. Timelines are particularly useful for project scheduling or project management when accompanied with a Gantt chart. It captures the main of what the project will accomplish and how it will be done. making a project timeline is one of the most important skills a project manager needs have. Making comprehensive, accurate timelines allows you getting every project off in the best way. ConceptDraw PRO allows you to draw a timeline charts using special library.HelpDesk
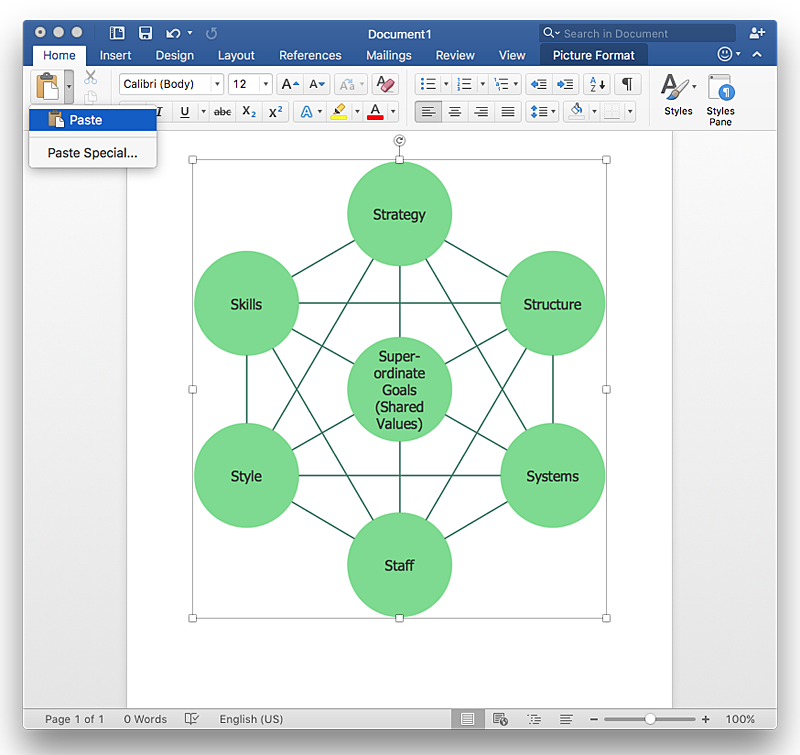
How to Add a Bubble Diagram to a MS Word Document Using ConceptDraw PRO
A bubble chart is a diagram in which the data points are replaced with bubbles, and the size of the bubbles represents some additional dimension of the data. A bubble chart does not have the axis. A bubble chart can be used instead of a scatter diagram if the data has three dimensions, each of that containing the set of values. The sizes of the bubbles are determined by the values in the third dimension. Any additional information about the entities beyond their three primary dimensions can be depicted by rendering bubbles in colors and patterns that are selected in a certain way. The legend containing the further information can be added to a bubble diagram. ConceptDraw PRO allows you to easily create various business management and marketing charts, including bubble diagrams and then add them to a MS Word document.
 Social Media Response
This solution extends ConceptDraw PRO and ConceptDraw MINDMAP with the ability to draw interactive flow charts with action mind map templates, to help create an effective response to applicable social media mentions.
 Event-driven Process Chain Diagrams
Event-driven Process Chain (EPC) Diagram is a type of flowchart widely used for modeling in business engineering and reengineering, business process improvement, and analysis. EPC method was developed within the Architecture of Integrated Information Systems (ARIS) framework.
 macOS User Interface
macOS User Interface solution extends the ConceptDraw PRO functionality with powerful GUI software graphic design features and tools. It provides an extensive range of multifarious macOS Sierra user interface design examples, samples and templates, and wide variety of libraries, containing a lot of pre-designed vector objects of Mac Apps icons, buttons, dialogs, menu bars, indicators, pointers, controls, toolbars, menus, and other elements for fast and simple designing high standard user interfaces of any complexity for new macOS Sierra.
 Floor Plans
Construction, repair and remodeling of the home, flat, office, or any other building or premise begins with the development of detailed building plan and floor plans. Correct and quick visualization of the building ideas is important for further construction of any building.
 Value Stream Mapping
Value stream mapping solution extends ConceptDraw PRO software with templates, samples and vector stencils for drawing the Value Stream Maps (VSM) in lean manufacturing practice.
- Best Diagramming Software for Mac | Business Productivity ...
- Technical Drawing Software | Entity Relationship Diagram Software ...
- Workflow Diagram Software Mac | Entity Relationship Diagram ...
- Basic Flowchart Symbols and Meaning | Entity Relationship ...
- ER Diagram Programs for Mac | Entity Relationship Diagram ...
- Workflow Diagram Software Mac | Business Productivity ...
- ConceptDraw PRO Database Modeling Software
- Best Flowchart Software | Form Maker | Entity - Relationship Diagram ...
- Entity Relationship Diagram Software Engineering | Professional ...
- ER diagram tool for OS X | Entity Relationship Diagram Software for ...
- Business Productivity Diagramming | Workflow Diagram Software ...
- Entity Relationship Diagram Software for Mac | Best Diagramming ...
- Business Productivity Diagramming | Entity Relationship Diagram ...
- Technical Drawing Software | ConceptDraw PRO The best Business ...
- Data Flow Diagrams
- Value Stream Mapping Symbols | Entity Relationship Diagram ...
- Workflow Diagram Software Mac | Entity Relationship Diagram ...
- Entity Relationship Diagram Software Engineering | Entity ...
- Business Productivity Diagramming | Entity Relationship Diagram ...
- Entity - relationship diagram (Crow's foot notation)


