Structured Systems Analysis and Design Method. SSADM with ConceptDraw DIAGRAM
Structured Systems Analysis and Design Method (abbr. SSADM) is a method developed in Great Britain and accepted in 1993 as a national standard for information systems development and analysis. SSADM is based on Data Flow Diagrams and is characterized with presence of clear sequence of steps at projecting, analysis, and documenting of information system. It involves 6 main stages: analysis of existing system or estimation of practicability, requirements definition, determination of technical requirements and equipment cost, development of logical data model, projecting of logical requirements and specification them, physical projecting. Each of them is also divided into several steps defining the tasks that should be fulfilled at a given stage. The most important SSADM elements are flows modeling with help of DFD, data logic modeling with help of LDS (Logical Data Structure) and description of entities behavior. Applying of SSADM is easy with ConceptDraw DIAGRAM diagramming and vector drawing software and Data Flow Diagram solution.SSADM Diagram
The vector stencils library SSADM from the solution Systems engineering contains specific symbols of SSADM diagrams for ConceptDraw DIAGRAM diagramming and vector drawing software. The Systems engineering solution is contained in Software Development area of ConceptDraw Solution Park. The example below illustrates the waterfall model used in SSADM. This model involves 5 stages of developing a product such as requirements specification and its' analysis, design, coding and testing."In software engineering, an entity–relationship model (ER model) is a data model for describing a database in an abstract way. ...
Crow's Foot notation is used in Barker's Notation, SSADM and Information Engineering. Crow's Foot diagrams represent entities as boxes, and relationships as lines between the boxes. Different shapes at the ends of these lines represent the cardinality of the relationship." [Entity–relationship model. Wikipedia]
This ERD example was redesigned using the ConceptDraw PRO diagramming and vector drawing software from the educational data base model. [www2.cs.uregina.ca/ ~bernatja/ crowsfoot.html]
The example "Entity-relationship diagram (Crow's foot notation)" is included in the Entity-Relationship Diagram (ERD) solution from the Software Development area of ConceptDraw Solution Park.
Entity Relationship Diagram Examples
ConceptDraw DIAGRAM diagramming and vector drawing software offers the Entity-Relationship Diagram (ERD) Solution from the Software Development Area for ConceptDraw Solution Park. How many examples contains the Entity-Relationship Diagram (ERD) Solution! All Entity Relationship Diagram examples were designed and saved for ConceptDraw DIAGRAM users. Now they are available from ConceptDraw STORE.ER Diagram Styles
When creating ER diagrams, you can apply different color ER diagram styles and also notation styles. ConceptDraw DIAGRAM enhanced with Entity-Relationship Diagram (ERD) Solution gives the ability to draw visual and attractive ER Diagrams using the style icons from Crow’s Foot notation and Chen's notation professionally designed and offered by ERD Chen's Notation and ERD Crow’s Foot Notation libraries.ERD Symbols and Meanings
Entity Relationship Diagram (ERD) is a popular software engineering tool for database modeling and illustration the logical structure of databases, which uses one of two notations - Chen's or Crow’s Foot. Crow's foot notation is effective when used in software engineering, information engineering, structured systems analysis and design. Each of these notations applies its own set of ERD symbols. Crow's foot diagrams use boxes to represent entities and lines between these boxes to show relationships. Varied shapes at the ends of lines depict the cardinality of a given relationship. Chen's ERD notation is more detailed way to represent entities and relationships. ConceptDraw DIAGRAM application enhanced with all-inclusive Entity-Relationship Diagram (ERD) solution allows design professional ER diagrams with Chen's or Crow’s Foot notation on your choice. It contains the full set of ready-to-use standardized ERD symbols and meanings helpful for quickly drawing, collection of predesigned ERD samples, examples and templates. ConceptDraw Pro is a great alternative to Visio for Mac users as it offers more features and can easily handle the most demanding professional needs.
Data Flow Diagrams
The information system manages the flow of data introduced into the system. To graphically represent and document the flow of data through some information system is used a Data Flow Diagram (DFD). DFD is a way to visualize the flow of data or data processing, to clearly demonstrate what type of data or information is transferred, where they come from and where are sent. It lets to create an overview of the system, to depict the major steps, and effectively model the processes. DFDs are helpful for analyzing and modifying the business systems. Traditionally are used two notations for DFDs creation - Yourdon-Coad and Gane-Sarson. ConceptDraw DIAGRAM software offers a special Data Flow Diagrams solution from Software Development area, which enables to quickly and simply create professional Data Flow Diagrams including the data storage, data flows, external entities, functional transforms, control transforms and signals. Use the offered templates, samples and extensive range of libraries to design your own Data Flow Diagrams in minutes."Crow's Foot notation is used in Barker's Notation, SSADM and Information Engineering. Crow's Foot diagrams represent entities as boxes, and relationships as lines between the boxes. Different shapes at the ends of these lines represent the cardinality of the relationship." [Entity–relationship model. Wikipedia]
The vector stencils library ERD, crow's foot notation contains 18 symbols for creating the ER-diagrams using the ConceptDraw PRO diagramming nd vector drawing software.
The example"Design elements - ERD solution (crow's foot notation)" is included in the Entity-Relationship Diagram (ERD) solution from the Software Development area of ConceptDraw Solution Park.
How to Draw EPC Diagram Quickly
An event-driven process chain diagram is a flowchart used in business process analysis. It evolved from Architecture of Integrated Information Systems (ARIS) and utilised in the business process improvement and analysis. It is also used to facilitate enterprise resource planning. An EPC diagram is a complex flowchart that shows different business processes through various workflows. The workflows are seen as functions and events that are connected by different teams or people, as well as tasks that allow business processes to be executed. ConceptDraw DIAGRAM is a software for making EPC diagrams that allows managers visually present business process models for making decisions for business.
Software Diagram Examples and Templates
ConceptDraw DIAGRAM is a powerful tool for business and technical diagramming. Software Development area of ConceptDraw Solution Park provides 5 solutions: Data Flow Diagrams, Entity-Relationship Diagram (ERD), Graphic User Interface, IDEFO Diagrams, Rapid UML.Vertical Cross Functional Flowchart
ConceptDraw DIAGRAM is a powerful tool that helps you create professional looking cross-functional flowcharts with the well-designed objects. ConceptDraw DIAGRAM - Drawing Software for Vertical Cross Functional Flowchart. ConceptDraw allows you to focus on work, not the drawing process. ConceptDraw Arrows10 Technology allows to draw connectors with smart behavior that gives flexibility to you during work process.Diagramming Software for UML Composite Structure Diagrams
UML Composite Structure Diagram shows the internal structure of a class and the possible interactions at this structure.
Flow Diagram
A flowchart can take any process and distil it into a series of actions or decisions; it is a versatile and simple form of diagram that can be used to describe situations in any field, and is easily understood by everyone. They are used frequently in business to document workflows from all areas of a company - they can show accounting purchase orders, human resource recruitment strategy, or a product life cycle. ConceptDraw DIAGRAM diagramming and vector drawing software extended with Flowcharts Solution from the "Diagrams" Area of ConceptDraw Solution Park is a perfect powerful tool for extremely easy designing professional looking Flow Diagram.Jackson Systems
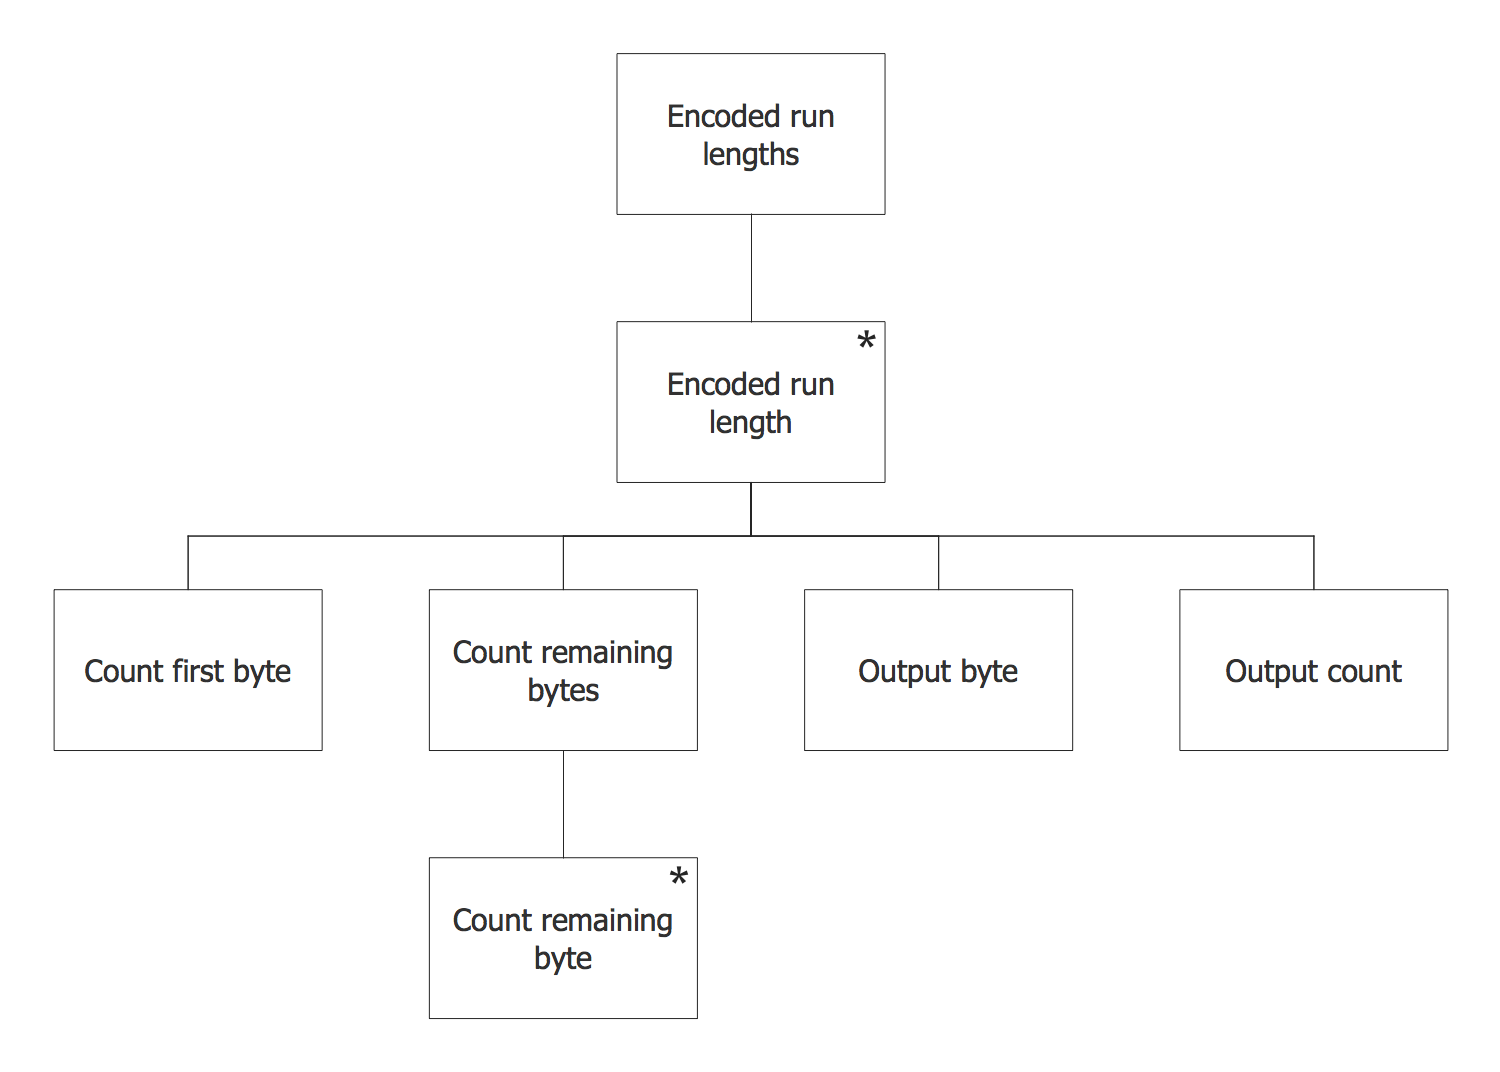
Entity structure diagram (ESD) notations may be created in the ConceptDraw DIAGRAM same as any other diagram, including a Jackson Structured Programming (JSP) Diagram. Having the Jackson Structured Programming (JSP) Diagrams solution may simplify the work of drawing the needed illustration representing the given data within only a few minutes. Having the pre-made examples of the JSP diagrams, any ConceptDraw DIAGRAM user is able to make his own unique as well as smart looking drawing in a fun and entertaining way.Wireframe Tools
A wireframe is a scheme of a future web page. Wireframe illustrates the web page structure, location and size of the main elements, as well as their interaction with the user. With such scheme designer defines the functionality of the page, not its appearance.ConceptDraw DIAGRAM Database Modeling Software
ConceptDraw DIAGRAM is a very easy-to-use and intuitive database design tool which can save you hundreds of work hours. See database diagram samples created with ConceptDraw DIAGRAM database modeling database diagram software.COM and OLE Diagram
The vector stencils library COM and OLE from the solution Software Engineering contains 15 symbols of the COM and OLE objects for ConceptDraw DIAGRAM diagramming and vector drawing software. The Software Engineering solution is contained in the Software Development area of ConceptDraw Solution Park.ConceptDraw Arrows10 Technology
When using a shapes′ center connection the connection becomes dynamic, the connector will trace the contour of the object, when moving the object inside your diagram. Using any other connection point provides a static connection, when you move connected objects the connector stays attached to the same point.UML Software
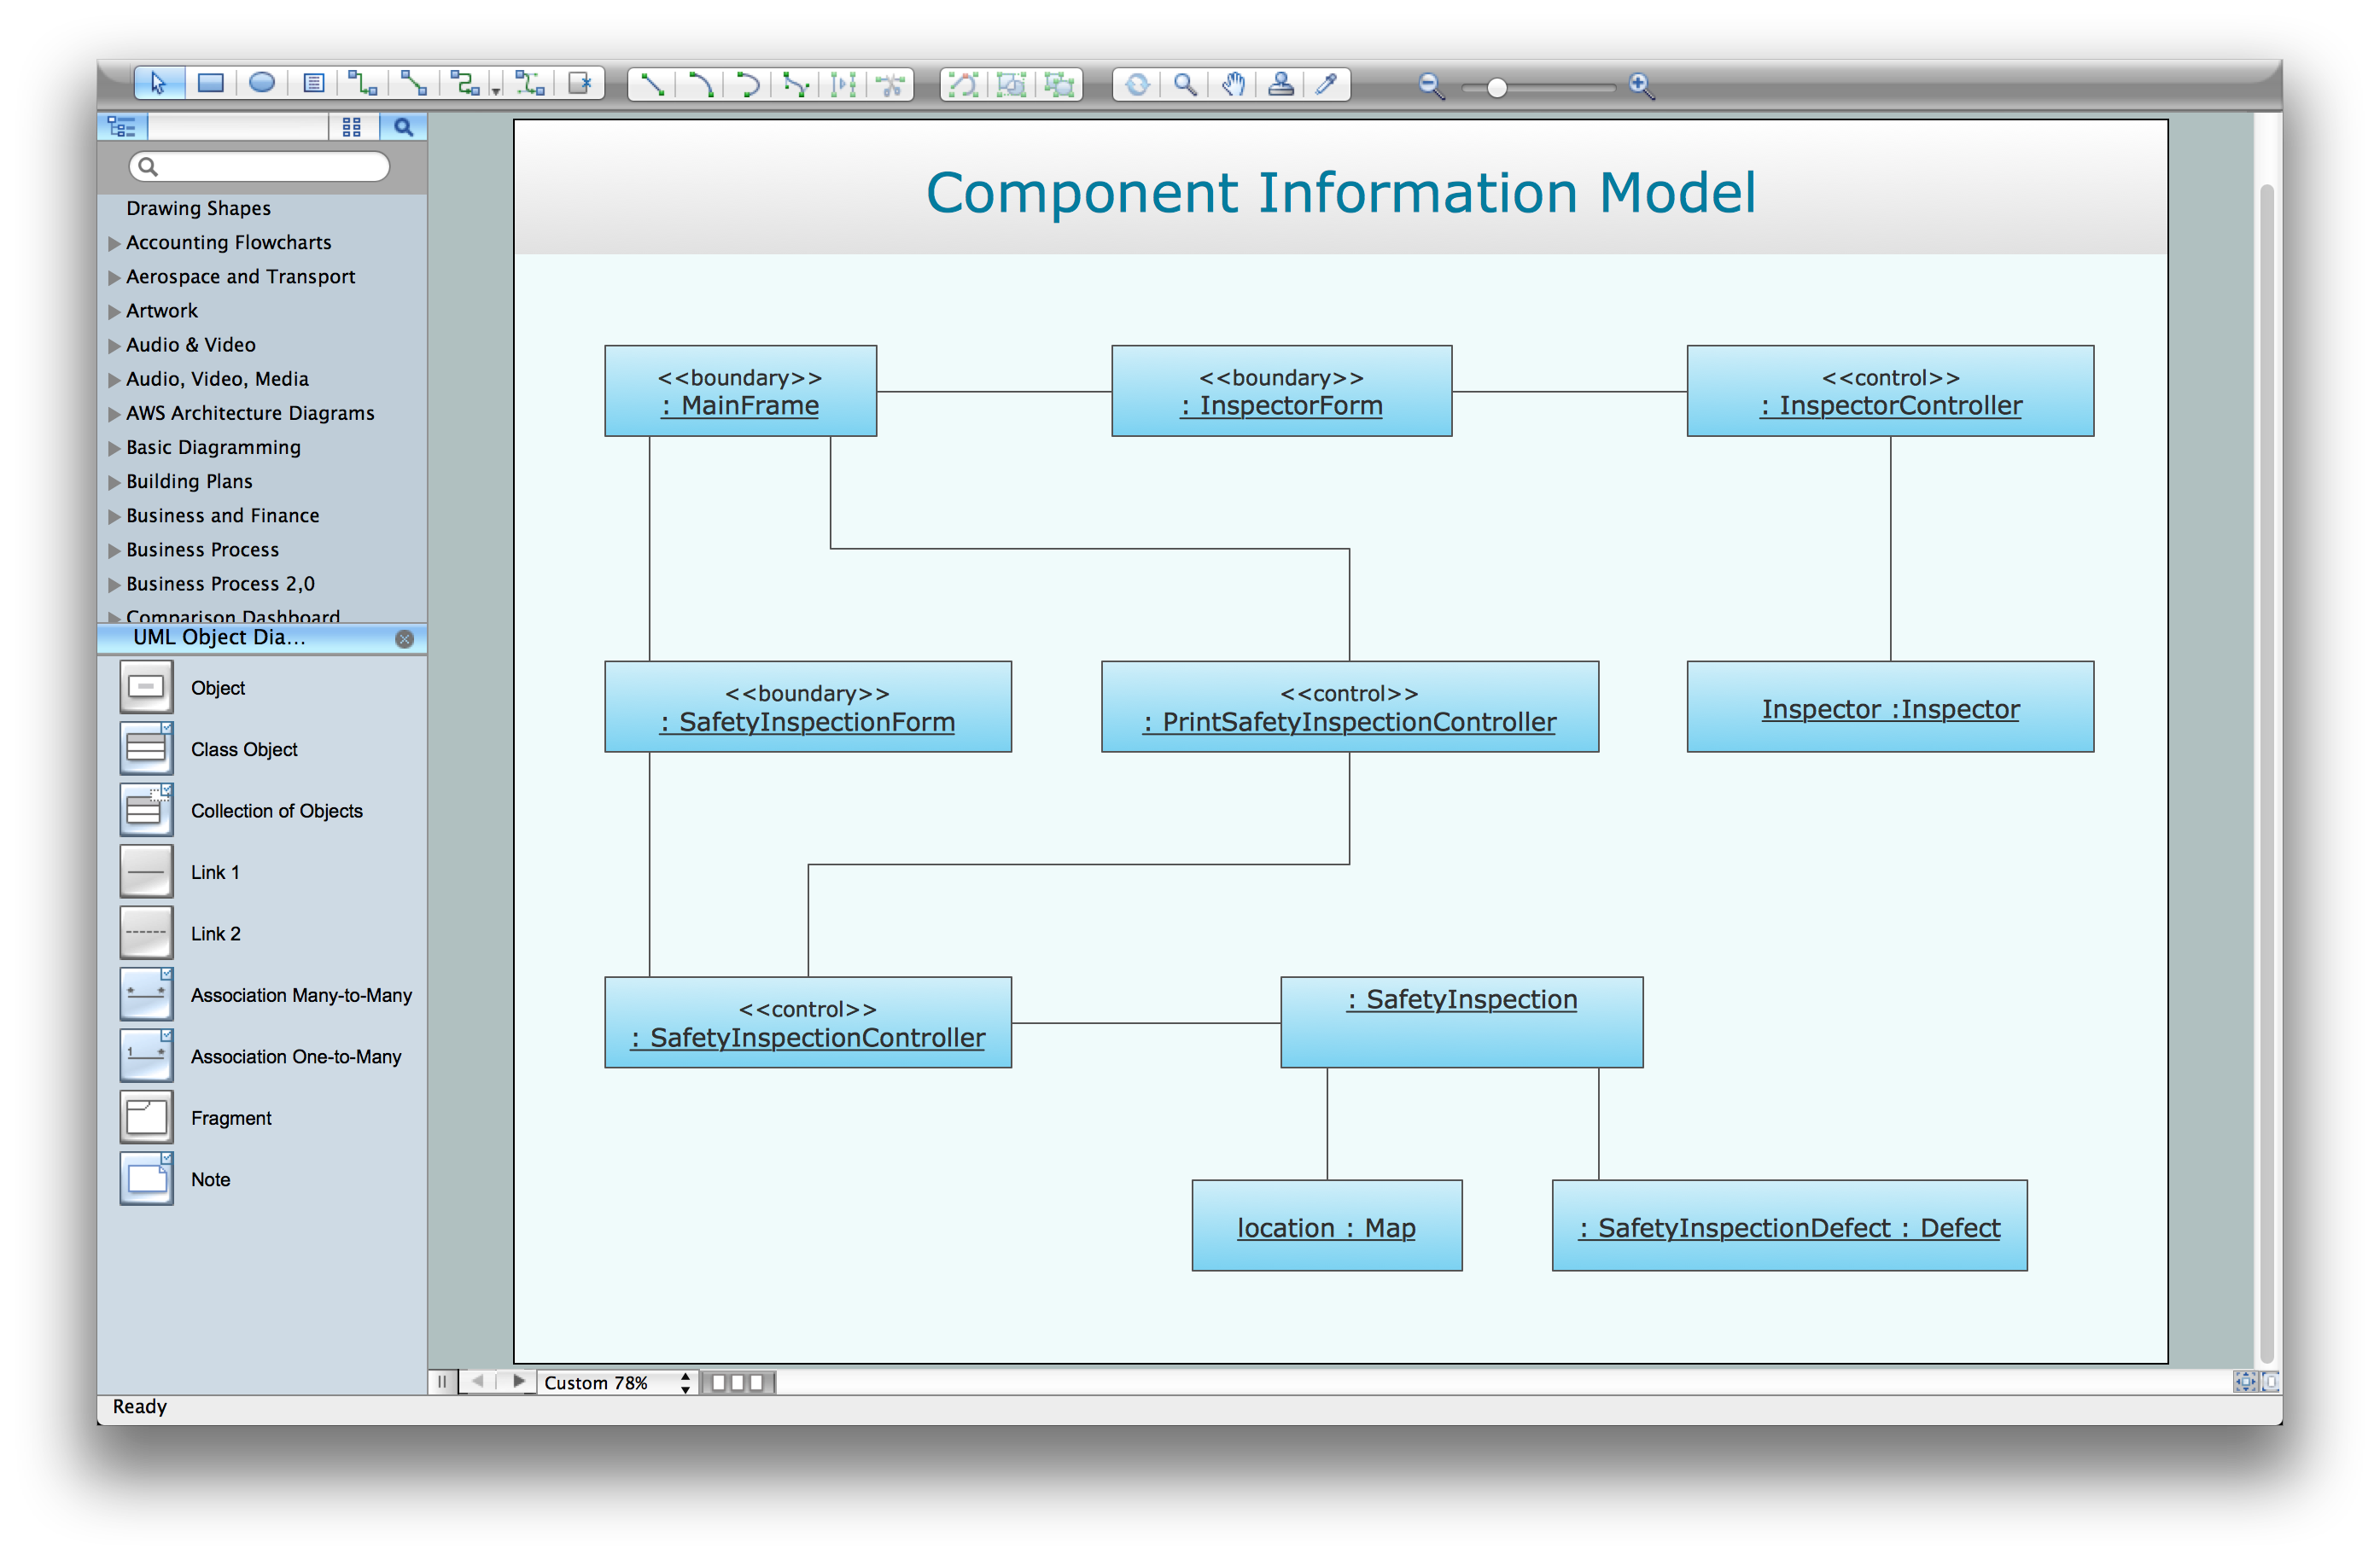
Unified Modeling Language (UML) is a language of graphic description for object modeling in the field of software engineering. UML was created for definition, visualization, designing of software systems. UML is an open standard that uses graphic notations for creating visual models of object-oriented software systems. The Rapid UML Solution for ConceptDraw DIAGRAM presentsthe intuitive RapidDraw interface that helps you to make the UML Diagram of any of these 13 types quick and easy.Software development with ConceptDraw DIAGRAM
Modern software development requires creation of large amount of graphic documentation, these are the diagrams describing the work of applications in various notations and cuts, also GUI design and documentation on project management. ConceptDraw DIAGRAM technical and business graphics application possesses powerful tools for software development and designing technical documentation for object-oriented projects. Solutions included to the Software Development area of ConceptDraw Solution Park provide the specialists with possibility easily and quickly create graphic documentation. They deliver effective help in drawing thanks to the included package of templates, samples, examples, and libraries with numerous ready-to-use vector objects that allow easily design class hierarchies, object hierarchies, visual object-oriented designs, flowcharts, GUI designs, database designs, visualize the data with use of the most popular notations, including the UML and Booch notations, easy manage the development projects, automate projection and development.- Entity - relationship diagram (Crow's foot notation) | Design elements ...
- Structured Systems Analysis and Design Method. SSADM with ...
- Entity Relationship Diagram Examples | Context Level Dfd For ...
- Martin ERD Diagram | Entity Relationship Diagram Symbols ...
- Structured Systems Analysis and Design Method ( SSADM ) with ...
- Entity Relationship Diagram Symbols | ERD Symbols and Meanings ...
- Design elements - ERD (crow's foot notation) | Crow's Foot Notation ...
- Entity - Relationship Diagram (ERD) | Entity - relationship model ...
- Structured Systems Analysis and Design Method. SSADM with ...
- Er Diagram Pdf In Tamil
- Structured Systems Analysis and Design Method ( SSADM ) with ...
- SSADM Diagram | Structured Systems Analysis and Design Method ...
- Entity - relationship model diagram | Entity - Relationship Diagram ...
- Crow's Foot Notation | Design elements - ERD (crow's foot notation ...
- Entity Relationship Diagram Of E Voting System
- Structured Systems Analysis and Design Method ( SSADM ) with ...
- Process Flowchart | SSADM Diagram | Software Diagrams | Diagram ...
- Entity Relationship Diagram Software Engineering | Entity ...
- Entity Relationship Diagram Symbols | How to Draw EPC Diagram ...


.png--diagram-flowchart-example.png)


.png--diagram-flowchart-example.png)


