ERD Symbols and Meanings


Entity Relationship Diagram Symbols

Entity-Relationship Diagram

Entity Relationship Diagram Software Engineering

Entity Relationship Diagram Software for Mac

Design Element: Crows Foot for Entity Relationship Diagram - ERD

Entity Relationship Diagram Examples

Components of ER Diagram

ER Diagram for Cloud Computing

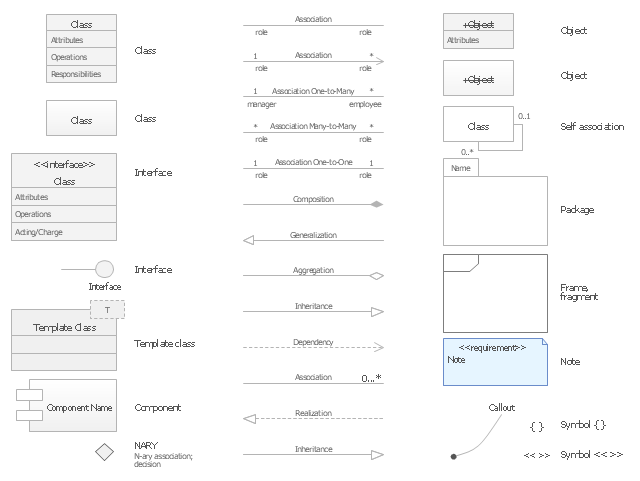
The vector stencils library "UML class diagrams" contains 38 symbols for the ConceptDraw PRO diagramming and vector drawing software.
"... classes are represented with boxes which contain three parts:
(1) The top part contains the name of the class. It is printed in Bold, centered and the first letter capitalized.
(2) The middle part contains the attributes of the class. They are left aligned and the first letter is lower case.
(3) The bottom part gives the methods or operations the class can take or undertake. They are also left aligned and the first letter is lower case. ...
To indicate a classifier scope for a member, its name must be underlined. ...
An association can be named, and the ends of an association can be adorned with role names, ownership indicators, multiplicity, visibility, and other properties. ...
Aggregation ... is graphically represented as a hollow diamond shape on the containing class end of the tree with a single line that connects the contained class to the containing class.
... graphical representation of a composition relationship is a filled diamond shape on the containing class end of the tree of lines that connect contained class(es) to the containing class.
... graphical representation of a Generalization is a hollow triangle shape on the superclass end of the line (or tree of lines) that connects it to one or more subtypes.
... graphical representation of a Realization is a hollow triangle shape on the interface end of the dashed line (or tree of lines) that connects it to one or more implementers. A plain arrow head is used on the interface end of the dashed line that connects it to its users.
Multiplicity ... representation of an association is a line with an optional arrowhead indicating the role of the object(s) in the relationship, and an optional notation at each end indicating the multiplicity of instances of that entity (the number of objects that participate in the association).
Entity classes ... are drawn as circles with a short line attached to the bottom of the circle. Alternatively, they can be drawn as normal classes with the «entity» stereotype notation above the class name." [Class diagram. Wikipedia]
The example "Design elements - UML class diagrams" is included in the Rapid UML solution from the Software Development area of ConceptDraw Solution Park.
UML class diagram symbols
"Crow's Foot notation is used in Barker's Notation, SSADM and Information Engineering. Crow's Foot diagrams represent entities as boxes, and relationships as lines between the boxes. Different shapes at the ends of these lines represent the cardinality of the relationship." [Entity–relationship model. Wikipedia]
The vector stencils library ERD, crow's foot notation contains 18 symbols for creating the ER-diagrams using the ConceptDraw PRO diagramming nd vector drawing software.
The example"Design elements - ERD solution (crow's foot notation)" is included in the Entity-Relationship Diagram (ERD) solution from the Software Development area of ConceptDraw Solution Park.
Crow's foot ERD
.png--diagram-flowchart-example.png)
- Entity Relationship Diagram Software for Mac | Drawing ER ...
- Sales And Market Entity Relation
- Entity Relation Diagram Of Wood Industry
- Entity Relationship Diagram Symbols | Components of ER Diagram ...
- Entity-Relationship Diagram (ERD) | Download Entity Relation Images
- Entity-Relationship Diagram (ERD) | Example Question And Answer ...
- Entity-Relationship Diagram (ERD) | Enhance Entity Relation ...
- Entity-Relationship Diagram (ERD) | Entity-relationship model ...
- Entity Relation Diagram For Online Gift Shop
- Atm Management System Dbms Project Entity Relation Diagram
- Bookshop Entity Relation Diagram
- How To Convert Entity Relation Diagram For Hrms Project Into ...
- ERD Symbols and Meanings | Connotations Entity Relation
- Process Flowchart | Components of ER Diagram | Entity ...
- Entity Relation Diagram Notation Meaning
- Entity Relation Diagram Of A Directory
- Dfd Entity Relation And System Flow Chart Of Hospital Management
- Entity-Relationship Diagram (ERD) | Relational Diagram Of Parking ...
- ConceptDraw DIAGRAM ER Diagram Tool | Entity-Relationship ...