 Target and Circular Diagrams
This solution extends ConceptDraw PRO software with samples, templates and library of design elements for drawing the Target and Circular Diagrams.
 Venn Diagrams
Venn Diagrams are actively used to illustrate simple set relationships in set theory and probability theory, logic and statistics, mathematics and computer science, linguistics, sociology, and marketing. Venn Diagrams are also often used to visually summarize the status and future viability of a project.
 Stakeholder Onion Diagrams
The Stakeholder Onion Diagram is often used as a way to view the relationships of stakeholders to a project goal. A basic Onion Diagram contains a rich information. It shows significance of stakeholders that will have has influence to the success achieve
HelpDesk
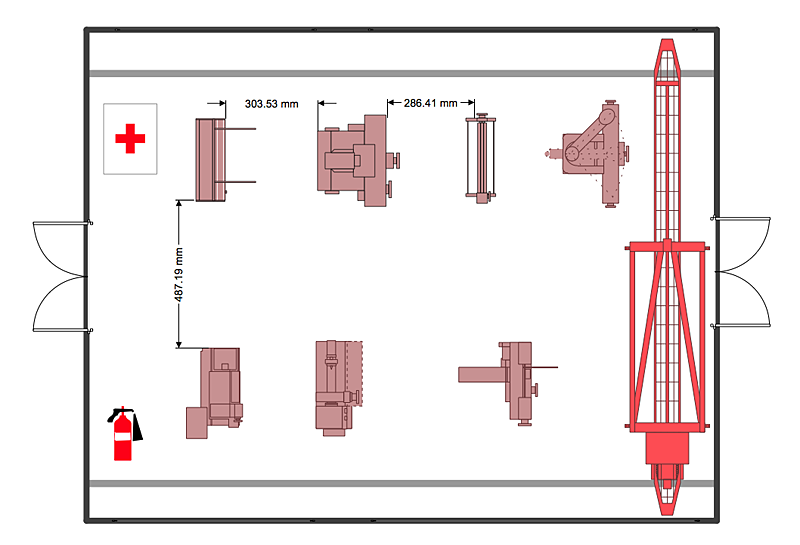
How to Create a Plant Layout Design
A plant construction process begins from a plant layout stage - an engineering stage used to design, analyze and finally choose the suitable configurations for a manufacturing plant. Plant Layout issues are core to any enterprise and are challenged in all types of manufacturing process. The sufficiency of layout influences the efficiency of subsequent operations. It is an important background for efficient manufacturing and also has a great deal with many questions. Once the place of the plant has been determined, the next important task before the management of the plant is to plan appropriate layout for the enterprise. Plant layout is used to create the most effective physical arrangement of machinery and equipment, with the plant building in such a manner so as to make quickest and cheapest way from a raw material to the shipment of the completed product Making a plan that shows the location of industrial equipment involves many different elements that can be managed using Con
 Circle-Spoke Diagrams
Examples of subject areas that are well suited to this approach are marketing, business, products promotion, process modeling, market, resource, time, and cost analysis. Circle-Spoke Diagrams are successfully used in presentations, conferences, management documents, magazines, reportages, reviews, reports, TV, and social media.
 Line Graphs
How to draw a Line Graph with ease? The Line Graphs solution extends the capabilities of ConceptDraw PRO v10 with professionally designed templates, samples, and a library of vector stencils for drawing perfect Line Graphs.
- Cycle Diagram Of Economic Planning
- Economic sector weightings | Room Planning Software | Porter's ...
- Diagram Of Economic Planning
- Seven Management and Planning Tools | Affinity diagram ...
- Process Flowchart | Seating Plans | Economic sector weightings ...
- Affinity diagram - Business expansion | BPR Diagram . Business ...
- Tree Diagram On Economic Planning
- Economic Planning Graphs
- Economic Planning By Chart Diagram
- Economic Calendar | Blank Calendar Template | Blank Calendar ...
- Affinity diagram - Business expansion | Affinity Diagram | Seven ...
- Affinity Diagram | How To Create an Affinity Diagram Using ...
- Calendars | Business diagrams & Org Charts with ConceptDraw ...
- Affinity Diagram | Affinity diagram - Implementing continuous ...
- Seven Management and Planning Tools | Affinity diagram template ...
- Sector diagram - Template | Economic sector weightings | Domestic ...
- Double Bar Diagram In Economic With Exqmple
- Calendars | Economic Calendar | Business diagrams & Org Charts ...
- Affinity Diagram | Affinity Diagram Software | Affinity diagram ...
- Target and Circular Diagrams | Affinity diagram - Business ...
