Entity Relationship Diagram Software Engineering
Entity Relationship Diagram (aka ER Diagram, E-R Diagram, ERD) is a time-tested and widespread software development and software engineering method for data modeling, illustrating the logical structure of databases and system design. For ERDs construction are used three basic elements: entities, attributes, and relationships. Chen's notation for ERD supposes the use of rectangles (boxes) to represent entities and diamonds to depict relationships between first-class objects. This notation is popular when creating conceptual data models of information systems. Another standardized notation for ER diagrams is Crow's foot notation. ConceptDraw DIAGRAM as a powerful Entity Relationship Diagram software engineering provides the tools of Entity-Relationship Diagram (ERD) solution from Software Development area of ConceptDraw Solution Park for instantly describing databases using ERDs of Crow’s Foot and Chen’s notations. Use the predesigned vector elements for both these notations from 2 libraries included to Entity-Relationship Diagram (ERD) solution.ConceptDraw DIAGRAM ER Diagram Tool
Entity-relationship model, also called ER-model, is the main tool of domain modeling on the stage of conceptual design. The modeling of domain data structures is based on the use of graphical tools - Entity-Relationship diagrams (ER-diagrams). The core concepts of ER-Diagram are entity, attribute and relationship. ER-diagram lets visually represent the entities, helps effectively document all properties of designed system and to detail the data storages. To represent the elements at ER-model are commonly used Chen’s notation and Crow’s foot notation, each has its pros and cons. The entity on ER-diagram is represented in the form of rectangle, which specifies its name. An attribute is a property of the entity and relationship is an interaction between the entities. The relationship between two entities is called binary, between more than two entities - ternary. Specific software, such as ConceptDraw DIAGRAM with Entity-Relationship Diagram (ERD) solution from ConceptDraw Solution Park is helpful for easy creation Entity-Relationship Diagrams.
 Entity-Relationship Diagram (ERD)
An Entity-Relationship Diagram (ERD) is a visual presentation of entities and relationships. That type of diagrams is often used in the semi-structured or unstructured data in databases and information systems. At first glance ERD is similar to a flowch
Block Diagram Software
The popularity of Block Diagrams grows day by day. The existence of powerful software for their design is an excellent news! ConceptDraw DIAGRAM Block Diagram Software offers the Block Diagrams Solution from the "Diagrams" Area.What is Entity-Relationship Diagram
Entity Relationship Diagram (ERD) is an acknowledged method to visualize the logical structure of databases. Using special symbols described in ERD notations you can depict a database of any complexity. The vector graphic ER diagrams produced when using ConceptDraw ERD solution can be used in whitepapers, presentations, datasheets, posters, or any technical materials.Entity Relationship Diagram - ERD - Software for Design Chen ER Diagrams
The Entity-Relationship Diagram (ERD) solution from ConceptDraw Solution Park extends ConceptDraw DIAGRAM ector graphics and diagramming software with the ability to describe a database using the Entity-Relationship (Chen) model. Use it for design your ERDs and verify that ConceptDraw DIAGRAM offers the best ERD diagrams software tools for design element Chen notation.UML Class Diagram Notation
When it comes to system construction, a class diagram is the most widely used diagram. UML Class Diagrams is a type of static structure diagram that is used for general conceptual modeling of the systematics of the application. Such a diagram would illustrate the object-oriented view of a system. The object orientation of a system is indicated by a class diagram. It describes the structure of a system by showing the general issues,classes of a system, attributes, operations, interfaces, inheritance, and the relationships between them.ConceptDraw DIAGRAM ER Diagram Tool
Entity-relationship model, also called ER-model, is the main tool of domain modeling on the stage of conceptual design. The modeling of domain data structures is based on the use of graphical tools - Entity-Relationship diagrams (ER-diagrams). The core concepts of ER-Diagram are entity, attribute and relationship. ER-diagram lets visually represent the entities, helps effectively document all properties of designed system and to detail the data storages. To represent the elements at ER-model are commonly used Chen’s notation and Crow’s foot notation, each has its pros and cons. The entity on ER-diagram is represented in the form of rectangle, which specifies its name. An attribute is a property of the entity and relationship is an interaction between the entities. The relationship between two entities is called binary, between more than two entities - ternary. Specific software, such as ConceptDraw DIAGRAM with Entity-Relationship Diagram (ERD) solution from ConceptDraw Solution Park is helpful for easy creation Entity-Relationship Diagrams.Rainfall Bar Chart
This sample shows the Horizontal Bar Chart of the average monthly rainfalls. This sample was created in ConceptDraw DIAGRAM diagramming and vector drawing software using the Bar Graphs Solution from the Graphs and Charts area of ConceptDraw Solution Park.Software Diagram Examples and Templates
ConceptDraw DIAGRAM is a powerful tool for business and technical diagramming. Software Development area of ConceptDraw Solution Park provides 5 solutions: Data Flow Diagrams, Entity-Relationship Diagram (ERD), Graphic User Interface, IDEFO Diagrams, Rapid UML.CCTV Network Diagram Software
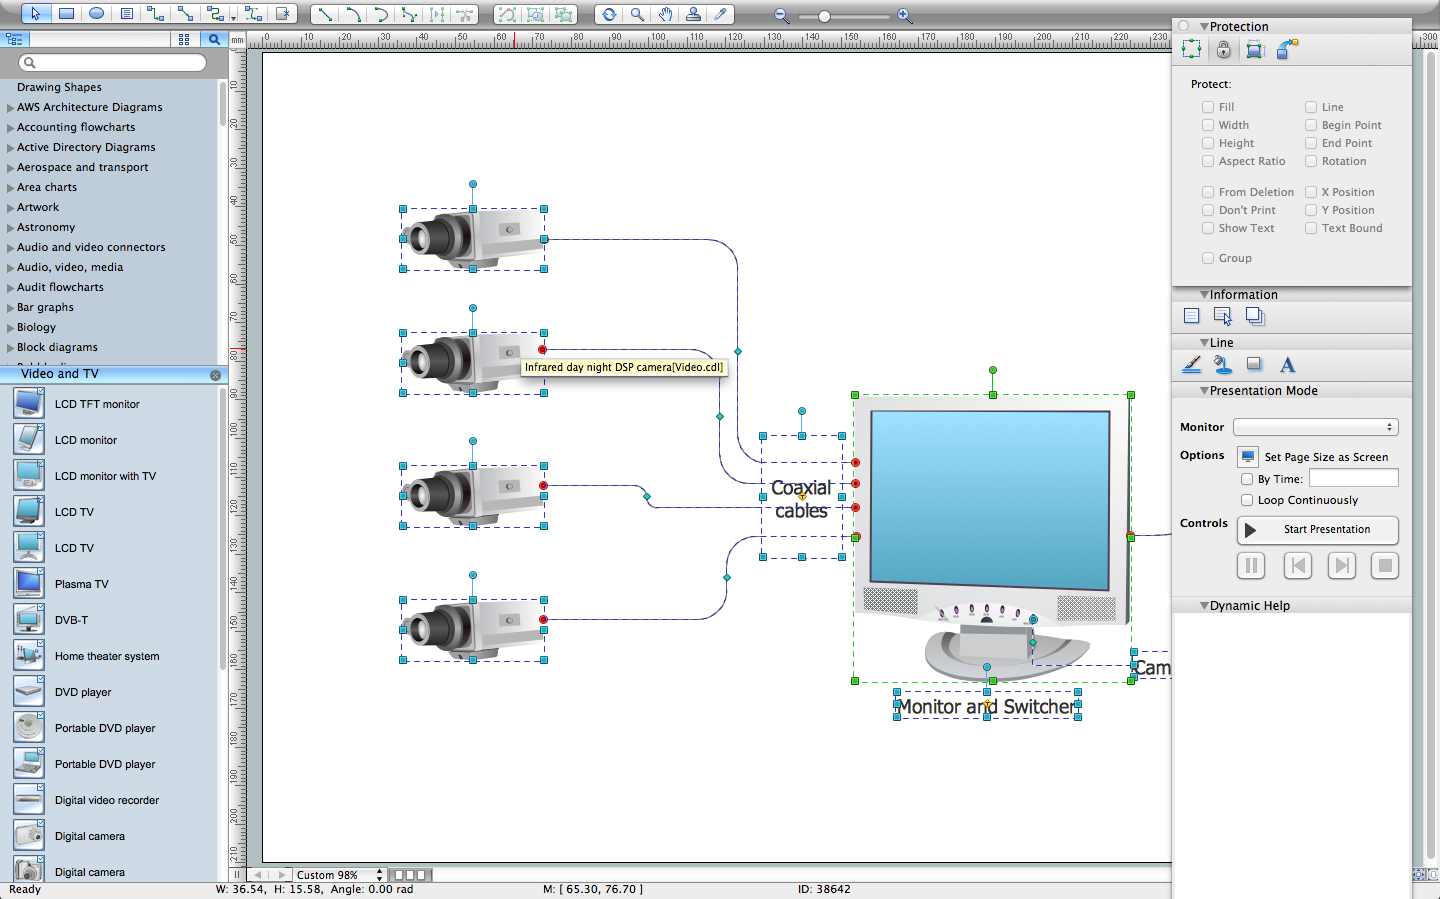
The CCTV is the process that carried out using the video cameras for transmitting the signal to the specific location, on the limited set of monitors. We are talking about the video cameras that are used for monitoring on such guarded objects as airports, banks, stores, military objects, etc. CCTV equipment is also used in the industrial installations, for surveillance in the public places, for recording the video on the digital video recorders.Process Flow Diagram Symbols
Chemical and Process Engineering Solution from the Industrial Engineering Area of ConceptDraw Solution Park is a unique tool which contains variety of predesigned process flow diagram symbols for easy creating various Chemical and Process Flow Diagrams in ConceptDraw DIAGRAM.Infographic design elements, software tools Subway and Metro style
Subway infographic design elements for ConceptDraw DIAGRAM (mac and pc).Sales Process Flowchart. Flowchart Examples
Sales Process Flowchart is an invaluable tool for business. It gives you opportunity to visualise and better understand the sales process, reveal and also visually highlight issues or bottlenecks, and predict the number of sales. The Flowchart is ideal method to represent in details all steps of the process, tasks and decisions needed to obtain maximum effectiveness and success. The steps are graphically represented by boxes linked with arrows indicating direction of the workflow, decision is shown by diamond. The sales process is closely linked to the company's success and usually includes the following main steps: Product knowledge, Prospecting, Planning the sale (Pre-approach), Approach, Need assessment, Presentation, Meeting objections, Gaining commitment, Follow-up. Create fast and easy your own Flowcharts of sales business processes using the ConceptDraw DIAGRAM ector graphic software extended with Cross-Functional Flowcharts solution from Business Processes area and also Sales Flowcharts solution from Marketing area of ConceptDraw Solution Park.Network Visualization with ConceptDraw DIAGRAM
ConceptDraw makes the entire process of network visualization easier thanks to the numerous ready-to-use objects included in the package for presentation of network equipment, LDAP directory symbols and many other objects that symbolize resources in most various representations.UML Component Diagram
UML Component Diagrams are used to illustrate the structure of arbitrarily complex systems and illustrates the service consumer - service provider relationship between components.
Circle Diagrams
The Circle Diagrams are the diagrams which represent the central element surrounded by other items in a circle. This type of diagram is very popular and widely used in marketing and management, for process modeling, market, resource, time and cost analysis, for visualization causes and effects. If you dream to design the Circle Diagrams quick and easy – the ConceptDraw DIAGRAM software extended with Circle-Spoke Diagrams Solution from the "Diagrams" Area is exactly what you need.The Sales Process
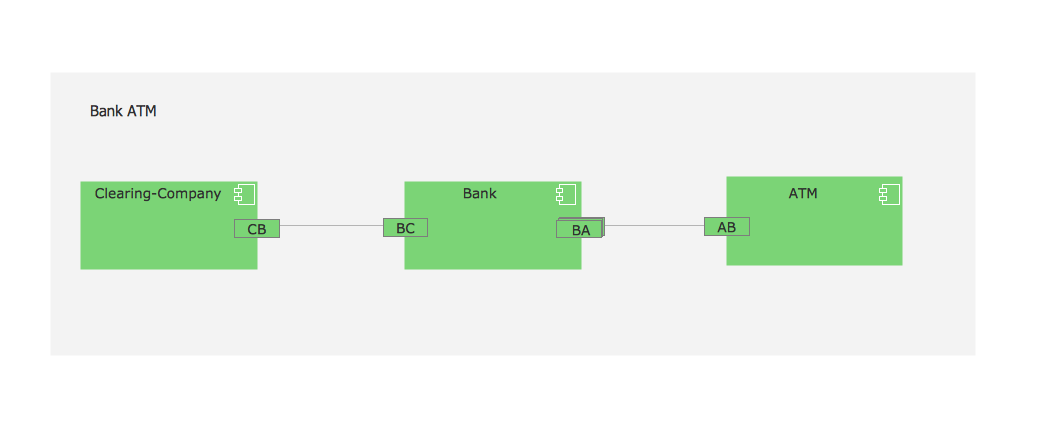
The Sales Process is a complex approach for selling a product or service which assumes many steps including the sales planning, realization of the sales marketing and management strategies, sales process analysis, etc. Now we have a ConceptDraw DIAGRAM software extended with unique Sales Flowcharts solution from the Marketing area of ConceptDraw Solution Park which ideally suits for the planning and realization the company's sales process.UML Component for Bank
UML Component for Bank - This sample was created in ConceptDraw DIAGRAM diagramming and vector drawing software using the UML Component Diagram library of the Rapid UML Solution from the Software Development area of ConceptDraw Solution ParkSecurity Plans
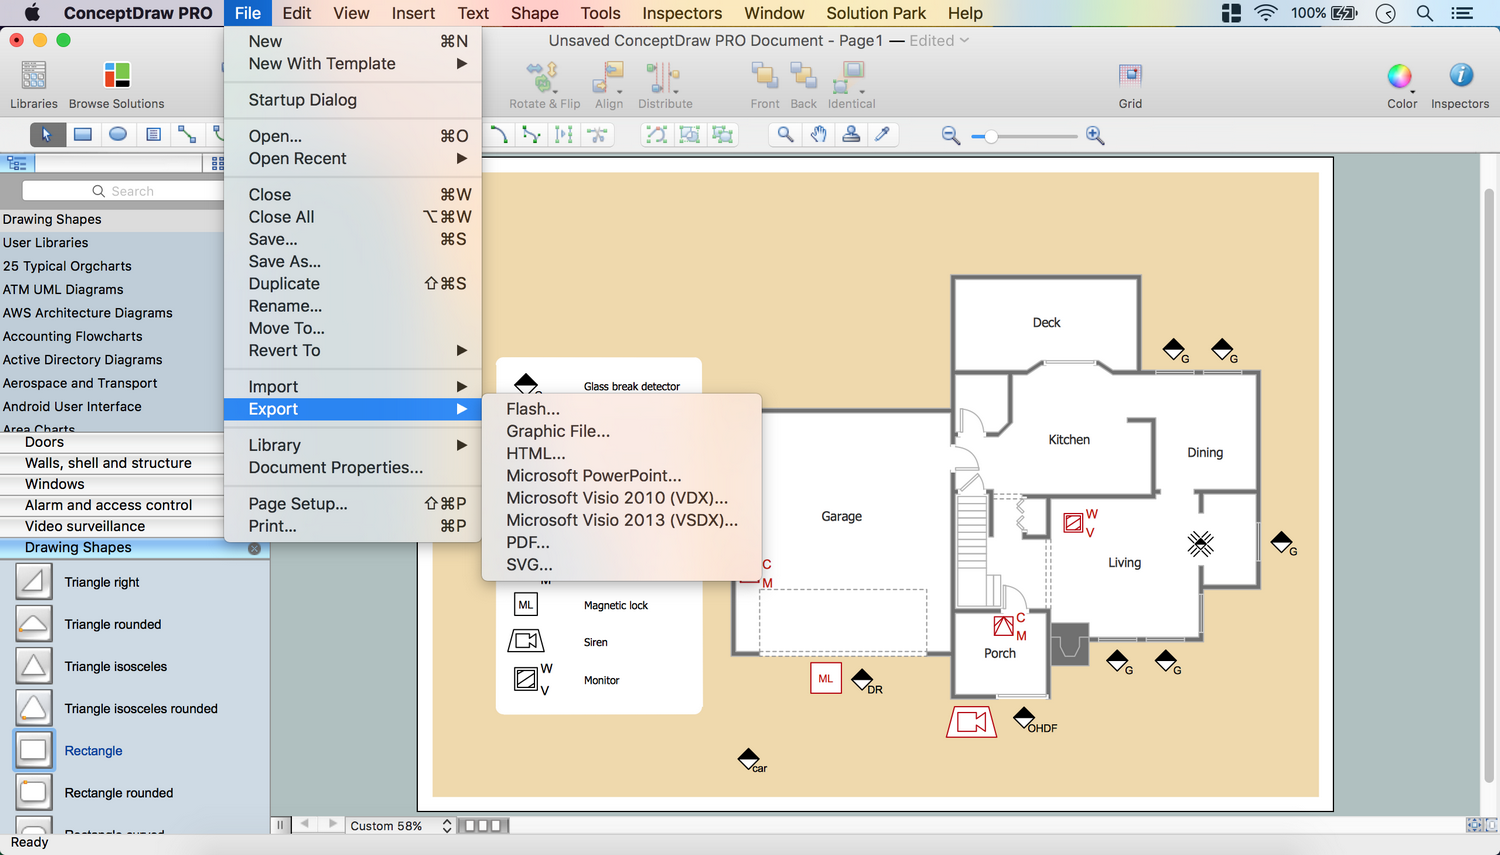
No security system cannot be constructed without detailed security plan, or even a set of plans in some cases. ConceptDraw DIAGRAM software offers the Security and Access Plans Solution from the Building Plans Area to help you design the Security Plans for any premises and of any complexity.- Erd Diagram Examples With Solution Ppt
- Entity Relationship Diagram Software Engineering | ERD Symbols ...
- How to Add a Bubble Diagram to a PowerPoint Presentation Using ...
- How To Draw Er Diagram In Ms Powerpoint
- Er Diagram Of Atm Ppt
- Entity Relationship Diagram Symbols | ER Diagram Styles | Entity ...
- Entity-Relationship Diagram ( ERD ) | Er Examples With Solutions
- Er Diagram Powerpoint
- Er Diagram For College Management System Ppt
- Entity Relationship Diagram Examples
- Component Diagram Tutorial With Examples Ppt Pdf
- Er Diagram Examples With Solutions Pdf
- Components of ER Diagram
- Entity-Relationship Diagram ( ERD ) | Eer Diagram Examples With ...
- Entity Relationship Diagram Symbols | Drawing ER diagrams on a ...
- Reverse Engineering Er Diagram Ppt
- Erd Examples Tutorials
- Entity Relationship Diagram Symbols | How to Add a Concept Map ...
- Entity Relationship Diagram Examples | UML Class Diagram ...


_Win_Mac.png)


