UML Class Diagram Generalization Example UML Diagrams
This sample was created in ConceptDraw PRO diagramming and vector drawing software using the UML Class Diagram library of the Rapid UML Solution from the Software Development area of ConceptDraw Solution Park. This sample describes the use of the classes, the generalization associations between them, the multiplicity of associations and constraints. Provided UML diagram is one of the examples set that are part of Rapid UML solution.Data Modeling with Entity Relationship Diagram
Data modeling is actively applied in analysis and uses wide set of methods for description the data requirements in a system. One of the most popular and well-known is the ERD method of database modeling. The best ERD tool for the Mac and Windows is ConceptDraw PRO software extended with the Entity-Relationship Diagram (ERD) solution from the Software Development Area for ConceptDraw Solution Park, which is sharpened for professional ERD drawing and data modeling with Entity Relationship Diagram.DFD Flowchart Symbols
A Data Flow Diagram (DFD) is a graphical technique which allows effectively model and analyze the information processes and systems. The ability to fast and easy create the DFDs is made possible with Data Flow Diagrams solution from the Software Development area of ConceptDraw Solution Park. For designing the Data Flow Diagrams are used simple DFD flowchart symbols which are connected each other by arrows depicting the data flow from one step to another.UML Deployment Diagram
UML Deployment Diagram depicts the physical deployment of artifacts on nodes (nodes are the existing hardware components, artifacts are the software components running on each node); and how the different pieces are connected. Use ConceptDraw PRO with UML deployment diagram templates, samples and stencil library from Rapid UML solution to model the physical deployment of artifacts on nodes of your software system.
Data Flow Diagrams
The information system manages the flow of data introduced into the system. To graphically represent and document the flow of data through some information system is used a Data Flow Diagram (DFD). DFD is a way to visualize the flow of data or data processing, to clearly demonstrate what type of data or information is transferred, where they come from and where are sent. It lets to create an overview of the system, to depict the major steps, and effectively model the processes. DFDs are helpful for analyzing and modifying the business systems. Traditionally are used two notations for DFDs creation - Yourdon-Coad and Gane-Sarson. ConceptDraw PRO software offers a special Data Flow Diagrams solution from Software Development area, which enables to quickly and simply create professional Data Flow Diagrams including the data storage, data flows, external entities, functional transforms, control transforms and signals. Use the offered templates, samples and extensive range of libraries to design your own Data Flow Diagrams in minutes.SDL Diagram
Specification and Description Language (SDL) is used for creating the object-oriented diagrams, visualizing the processes of the state machines for the systems of communication, telecommunication, automotive, aviation and medical industries. SDL is a specification language for creating specifications, descriptions of the behavior, data, and inheritance for real-time systems. This sample shows the SDL Diagram of the process game.State Diagram Example - Online Store
This sample was created in ConceptDraw PRO diagramming and vector drawing software using the UML State Mashine Diagram library of the Rapid UML Solution from the Software Development area of ConceptDraw Solution Park. This sample shows the work of the online store and can be used for the understanding of the online shopping processes, for projection and creating of the online store.UML Component for Bank
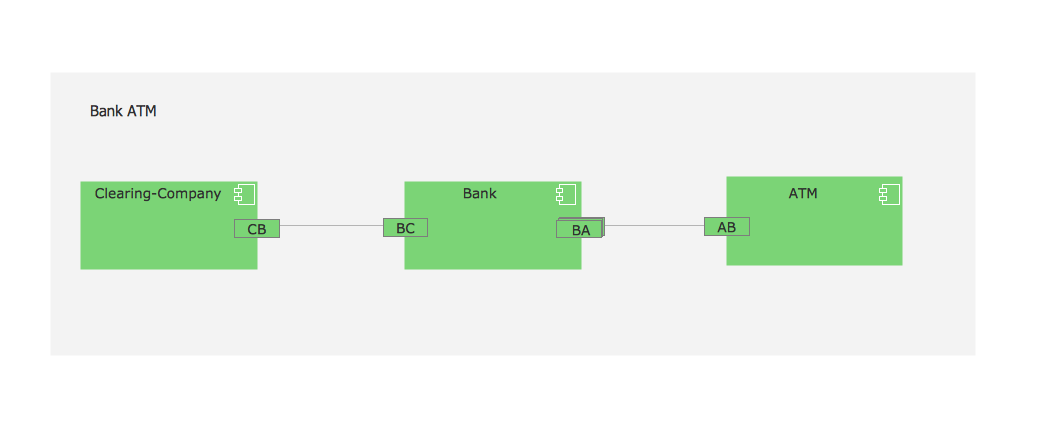
UML Component for Bank - This sample was created in ConceptDraw PRO diagramming and vector drawing software using the UML Component Diagram library of the Rapid UML Solution from the Software Development area of ConceptDraw Solution ParkDeveloping Entity Relationship Diagrams
When you need to visually represent the structure of relational database, Entity relationship diagram (ERD) is a type of diagram for that case. Most entity-relationship diagrams can be built with objects from Flowchart solution or ERD Solution which contains inbuilt templates. Follow these steps to create your own custom ERD diagram. Don't be frightened if it looks complex, ConceptDraw PRO makes it easy to create an ERD, and hundreds of other diagrams, in minutes.E-R Diagrams
Complexity of databases increases day by day, due to this the Entity relationship models and E-R diagrams become more and more popular, and now are an important part of database design. E-R diagrams created at ConceptDraw PRO allow visually and graphically represent structure and design of databases.- Er Diagram For Medical Store Management System
- Er Diagram For Online Medical Store Management System
- Er Diagram Online Hardware Shop Manement System
- Medical Store Management System Er Diagram Meaning Of Staff
- Er Model For Medical Management System
- Er Diagram For Pharmacy Management System
- ER Diagram for Cloud Computing | Example of DFD for Online Store ...
- Er Diagram Of Medical Store Step By Step Showing System
- Entity-Relationship Diagram ( ERD ) | Er Diagram Of Online Shopping ...
- Example of DFD for Online Store (Data Flow Diagram) DFD ...


