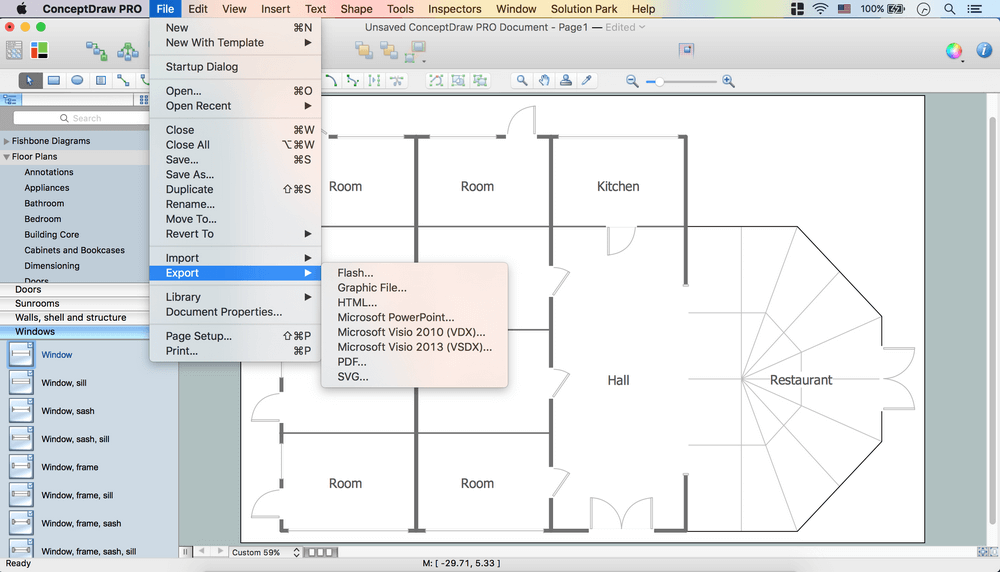
Create Floor Plans Easily with ConceptDraw DIAGRAM
How to create Floor Plan Design easy and effectively? You can invite an interior designer and trust this work to him, which is usually expensive and result may not always meet your expectations. Another way is to design it yourself, but at this case you need to have special skills, knowledges and abilities, among them basic knowledge of the composition rules, color theory, materials science and software for interior design development. The ability to use specialized software for drawing is especially valuable, useful and saves your time. ConceptDraw DIAGRAM is one of the best among similar software, it offers extensive functionality, powerful tools, a lot of features, and is simple for using, so can be applied by everyone without efforts. Enhanced with Floor Plans and other solutions from the Building Plans area, the ConceptDraw DIAGRAM software helps easily create unique and harmonious interior designs, and draw in desired scale professional-looking Floor Plans and Layouts for homes, apartments, hotels, offices, and other buildings. ConceptDraw DIAGRAM is a full Visio compatibility and better alternative for students, teachers and business professionals to reliably create kinds of flowcharts, organizational charts, network diagrams, floor plans, electrical diagrams, software design diagrams, maps and more.
 MindTweet
This solution extends ConceptDraw MINDMAP software with the ability to brainstorm, review and organize the sending of Tweets.
 Language Learning
Language Learning solution extends ConceptDraw DIAGRAM software with templates, samples and library of vector stencils for drawing the sentence diagrams.
 Business and Finance
Use Business and Finance solution to make professional-looking documents, presentations and websites, business, finance, advertising, and project management illustrations, or any designs that requires clipart of currency, office, business, advertising, management, marketing, people, time, post, contacts, collaboration, etc.
 Area Charts
Area Charts are used to display the cumulative totals over time using numbers or percentages; or to show trends over time among related attributes. The Area Chart is effective when comparing two or more quantities. Each series of data is typically represented with a different color, the use of color transparency in an object’s transparency shows overlapped areas and smaller areas hidden behind larger areas.
 eLearning for Skype
This solution extends ConceptDraw MINDMAP software with the ability to prepare and run remote learning sessions by using Skype
- School Management System ER Diagram
- ER Diagram For School Management With Conversion Tables
- ER Diagram For School Management
- Entity Relationship Diagram Data Model
- Entity Relationship Diagram Of School Managemnet System
- Erd For Gym Management System
- Er Diagram For Student And Teacher Management Aysten
- Entity Relationship Diagram Software Engineering
- Image Of Crow Foot For School Management
- Entity Relationship Diagram Software Engineering | Entity ...
- Entity Relationship Diagram Software
- ER Diagram For Represent Student Management
- Convert Dfd To Erd
- Software and Database Design with ConceptDraw PRO | ERD ...
- Erd Diagram For Sports Management
- UML use case diagram - Banking system
- Er Diagram Between Student Teacher School
- Entity Relationship Diagram On Login Form
- Components of ER Diagram | ERD Symbols and Meanings | Entity ...
- Er Diagram Of Student And Teacher
