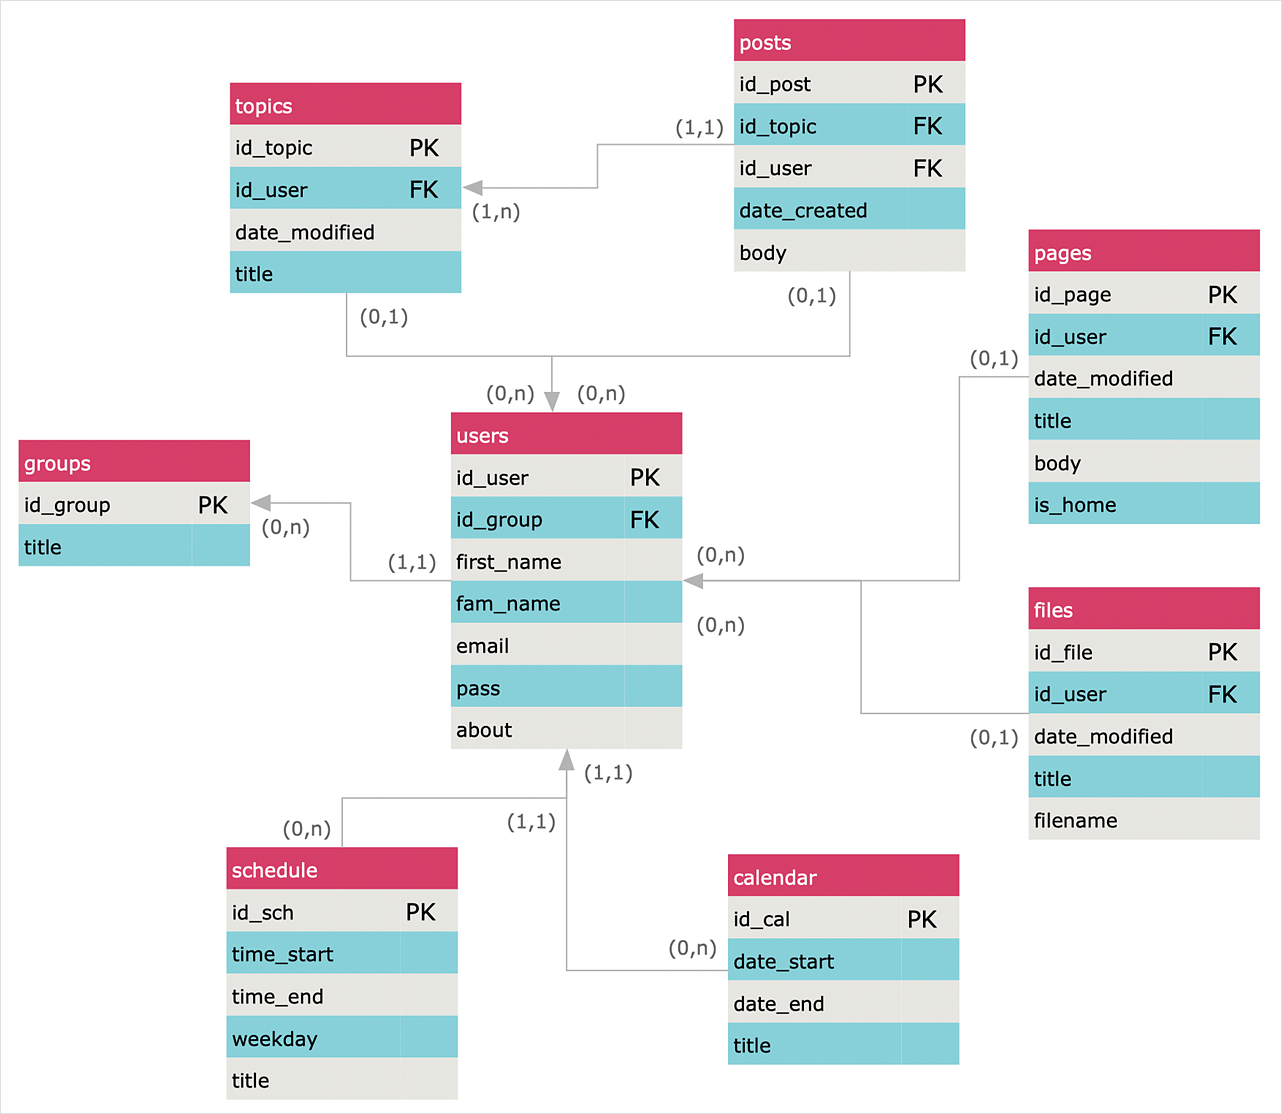
 Entity-Relationship Diagram (ERD)
An Entity-Relationship Diagram (ERD) is a visual presentation of entities and relationships. That type of diagrams is often used in the semi-structured or unstructured data in databases and information systems. At first glance ERD is similar to a flowch
Design Element: Rack Diagram for Network Diagrams
ConceptDraw DIAGRAM is perfect for software designers and software developers who need to draw Rack Diagrams.
HelpDesk
How to Create an Entity-Relationship Diagram
ERD (entity relationship diagram) is used to show the logical structure of databases. It represents the interrelationships between components of a database (entities). Entity relationship diagrams are widely used in software engineering. Using ERD software engineers can control every aspect of database development. ER diagram can be used as the guide for testing and communicating before the release of a software product. ERD displays data as entities that are connected with connections that show the relationships between entities. There are some ERD notations used by databases developers for representing the relationships between the data objects. ConceptDraw DIAGRAM and its ERD solution allow you to build ERD diagram of any notation.Bubble diagrams in Landscape Design with ConceptDraw DIAGRAM
Bubble Diagrams are the charts with a bubble presentation of data with obligatory consideration of bubble's sizes. They are analogs of Mind Maps and find their application at many fields, and even in landscape design. At this case the bubbles are applied to illustrate the arrangement of different areas of future landscape design, such as lawns, flowerbeds, playgrounds, pools, recreation areas, etc. Bubble Diagram helps to see instantly the whole project, it is easy for design and quite informative, in most cases it reflects all needed information. Often Bubble Diagram is used as a draft for the future landscape project, on the first stage of its design, and in case of approval of chosen design concept is created advanced detailed landscape plan with specification of plants and used materials. Creation of Bubble Diagrams for landscape in ConceptDraw DIAGRAM software is an easy task thanks to the Bubble Diagrams solution from "Diagrams" area. You can use the ready scanned location plan as the base or create it easy using the special ConceptDraw libraries and templates.
 Enterprise Architecture Diagrams
Enterprise Architecture Diagrams solution extends ConceptDraw DIAGRAM software with templates, samples and library of vector stencils for drawing the diagrams of enterprise architecture models.
 Fault Tree Analysis Diagrams
This solution extends ConceptDraw DIAGRAM.5 or later with templates, fault tree analysis example, samples and a library of vector design elements for drawing FTA diagrams (or negative analytical trees), cause and effect diagrams and fault tree diagrams.
Garrett IA Diagrams with ConceptDraw DIAGRAM
Garrett IA diagrams are used at development of Internet-resources, in particulars at projecting of interactions of web-resource elements. The diagram of information architecture of the web resource which is constructed correctly with necessary details presents to developers the resource in comprehensible and visual way.- Er Model For Restaurant
- Entity-Relationship Diagram ( ERD ) | Cafe and Restaurant Floor Plan ...
- Example Erd Of Restaurant System
- Restaurant Erd Diagram
- Jacobson Use Cases Diagram | Use case restaurant model | UML ...
- Erd For Restaurant
- Entity Relationship Diagram - ERD - Software for Design Crows Foot ...
- Entity-Relationship Diagram ( ERD ) | ConceptDraw PRO ER ...
- Components of ER Diagram | Entity Relationship Diagram Symbols ...
- Design elements - ERD (crow's foot notation) | UML Notation ...
- Jacobson Use Cases Diagram | UML Business Process | Use case ...
- Jacobson Use Cases Diagram | Use case restaurant model | UML ...
- ConceptDraw PRO Database Modeling Software | Data structure ...
- Er Diagram For Restaurant Management System Pdf
- Restaurant For Use Case Diagram And Data Flow Diagram
- Erd Crow S Foot Restaurant
- How To Create Restaurant Floor Plan in Minutes | Entity ...
- Entity Relationship Diagram - ERD - Software for Design Crows Foot ...
- Chen's ERD of MMORPG | How To Create Restaurant Floor Plan in ...
- Entity Relationship Diagram Symbols | ConceptDraw PRO ER ...
.png)


