This site uses cookies. By continuing to browse the ConceptDraw site you are agreeing to our Use of Site Cookies.

Entity Relationship Diagram - ERD - Software for Design Crows Foot ER Diagrams

Crow's Foot notation was proposed by Gordon Everest. According to this notation, the entity is represented by rectangle, relation is depicted by line which ties two entities involved in a relationship. Entity-relationship diagrams based on both Chen's and Crow's Foot notations, can be easily drawn using the ConceptDraw DIAGRAM ERD diagrams software tools for design element Crow's Foot and Chen from Entity-Relationship Diagram (ERD) solution.
How to Build an Entity Relationship Diagram (ERD)

Design Element: Crows Foot for Entity Relationship Diagram - ERD

Creating an ERD requires choosing a specific set of notations that best serve the specific database being designed. ConceptDraw DIAGRAM software extended with Entity-Relationship Diagram (ERD) solution from Software Development area of ConceptDraw Solution Park allows you to draw ER diagrams for depicting a database using the ERD diagram design element Crow's Foot - Crow′s Foot notation icons.

entity-relationship diagram, ER-diagram, database ERD Entity-Relationship Diagram (ERD)

entity-relationship diagram, ER-diagram, database ERD
An Entity-Relationship Diagram (ERD) is a visual presentation of entities and relationships. That type of diagrams is often used in the semi-structured or unstructured data in databases and information systems. At first glance ERD is similar to a flowch

Developing Entity Relationship Diagrams

When you need to visually represent the structure of relational database, Entity relationship diagram (ERD) is a type of diagram for that case.
Most entity-relationship diagrams can be built with objects from Flowchart solution or ERD Solution which contains inbuilt templates. Follow these steps to create your own custom ERD diagram.
Don't be frightened if it looks complex, ConceptDraw DIAGRAM makes it easy to create an ERD, and hundreds of other diagrams, in minutes.

Example of DFD for Online Store (Data Flow Diagram)

Data flow diagrams (DFDs) reveal relationships among and between the various components in a program or system. DFDs are an important technique for modeling a system’s high-level detail by showing how input data is transformed to output results through a sequence of functional transformations.
Example of DFD for Online Store shows the Data Flow Diagram for online store and interactions between the Visitors, Customers and Sellers, as well as Website Information and User databases.
Steps to Creating a Sales Process Flow Chart

Flowchart Components

The ConceptDraw Flowchart component includes a set of samples and templates. This geathered as flowchart maker toolbox which focused on drawing flowcharts of any industry standards.

UML Class Diagram Notation

When it comes to system construction, a class diagram is the most widely used diagram. UML Class Diagrams is a type of static structure diagram that is used for general conceptual modeling of the systematics of the application. Such a diagram would illustrate the object-oriented view of a system. The object orientation of a system is indicated by a class diagram. It describes the structure of a system by showing the general issues,classes of a system, attributes, operations, interfaces, inheritance, and the relationships between them.

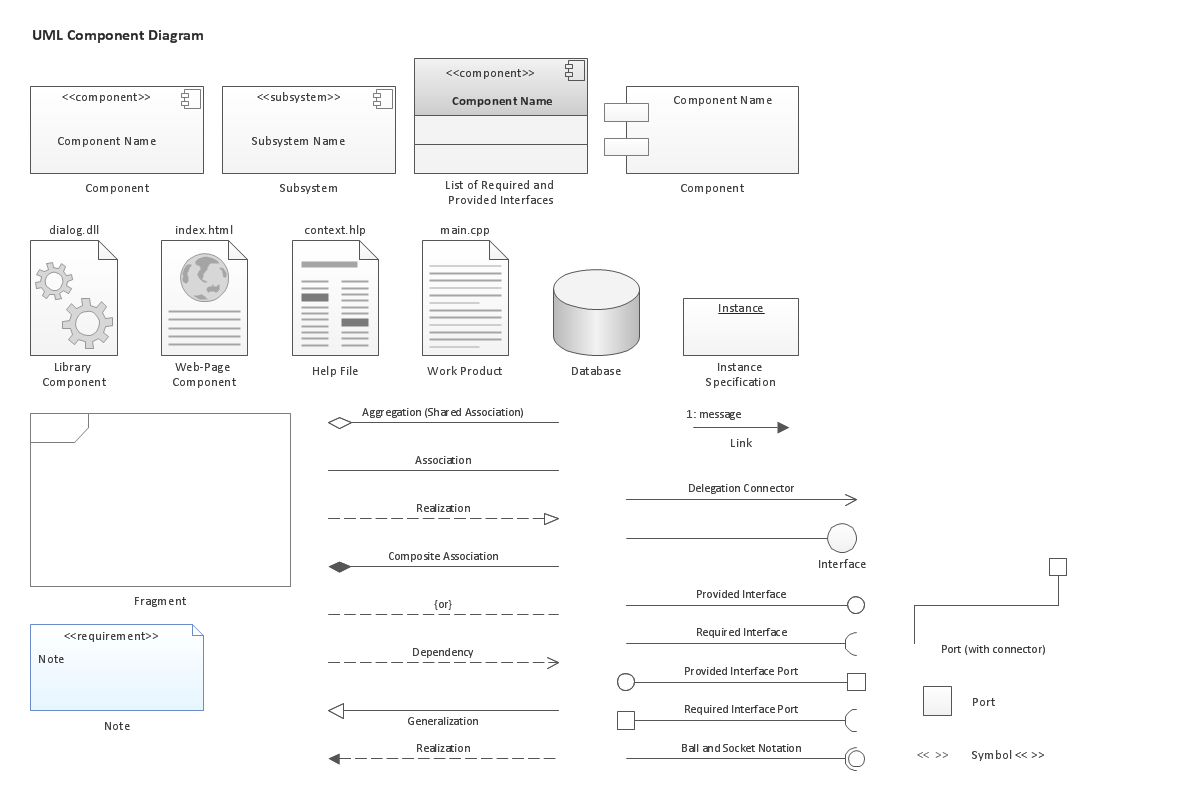
UML Component Diagram. Design Elements

UML Component Diagram illustrates show components are wired together to larger components and software systems that shows the structure of arbitrarily complex systems.
Rapid UML Solution for ConceptDraw DIAGRAM contains 13 vector stencils libraries with 393 interactive shapes that you can use to design your UML diagrams.
To design a Component Diagram use the UML Component Diagram library.
UML Component Diagram library contains 36 shapes

ERD, entity-relationship diagram, ER-diagram, Crow’s Foot Notation Crow's Foot Notation

ERD, entity-relationship diagram, ER-diagram, Crow’s Foot Notation
Crow’s Foot Notation solution extends ConceptDraw DIAGRAM software with powerful drawing tools, samples and library of predesigned vector Crow's Foot notation icons to help you easy describe the databases using the Entity-Relationship models and design professional-looking ER diagrams based on the popular Crow's Foot notation.

Network Visualization with ConceptDraw DIAGRAM

ConceptDraw makes the entire process of network visualization easier thanks to the numerous ready-to-use objects included in the package for presentation of network equipment, LDAP directory symbols and many other objects that symbolize resources in most various representations.