Entity Relationship Diagram Symbols
The semantic modeling method nowadays is successfully applied in database structure design. It is effective method of modeling the data structures, which is based on the meaning of these data. As a tool of semantic modeling, there are used different types of Entity-Relationship Diagrams. Entity Relationship Diagram (ERD) is applied to visually and clearly represent a structure of a business database. The main components of ERDs are: entity, relation and attributes. An entity is a class of similar objects in the model, each entity is depicted in the form of rectangle and has the name expressed by a noun. Relation is shown in the form of non-directional line that connects two entities. There are several notation styles used for ERDs: information engineering style, Chen style, Bachman style, Martin Style. The Entity Relationship Diagram symbols used for professional ERD drawing are predesigned by professionals and collected in the libraries of the Entity-Relationship Diagram (ERD) solution for ConceptDraw DIAGRAM software.Entity Relationship Diagram Examples
Creation of Entity-Relationship (ER) model is a visual representation the structure of a business database, where data equates to entities or objects, which are linked by defined relationships expressing dependencies and requirements. By the nature, the ER model is an abstract visualization, a first step in design process towards creating a logical and functional database. ConceptDraw DIAGRAM professional software gives the ability to effectively describe a database using the Entity-Relationship model. Included to ConceptDraw Solution Park, the Entity-Relationship Diagram (ERD) solution contains the set of predesigned vector icons advocated by Chen's and Crow’s Foot notations that both can be used for data modeling and describing a database. Entity-Relationship Diagram (ERD) solution includes also helpful templates and incredibly large collection of varied Entity Relationship Diagram examples and samples offered at ConceptDraw STORE. Each of them can be used to develop your own model of a database of arbitrary complexity.
Venn Diagram Examples for Problem Solving
Venn diagrams are illustrations used in the branch of mathematics known as set theory. They show the mathematical or logical relationship between different groups of things (sets). A Venn diagram shows all the possible logical relations between the sets.UML Use Case Diagram Example. Registration System
This sample was created in ConceptDraw DIAGRAM diagramming and vector drawing software using the UML Use Case Diagram library of the Rapid UML Solution from the Software Development area of ConceptDraw Solution Park. This sample shows the types of user’s interactions with the system and is used at the registration and working with the database system.Process Mapping
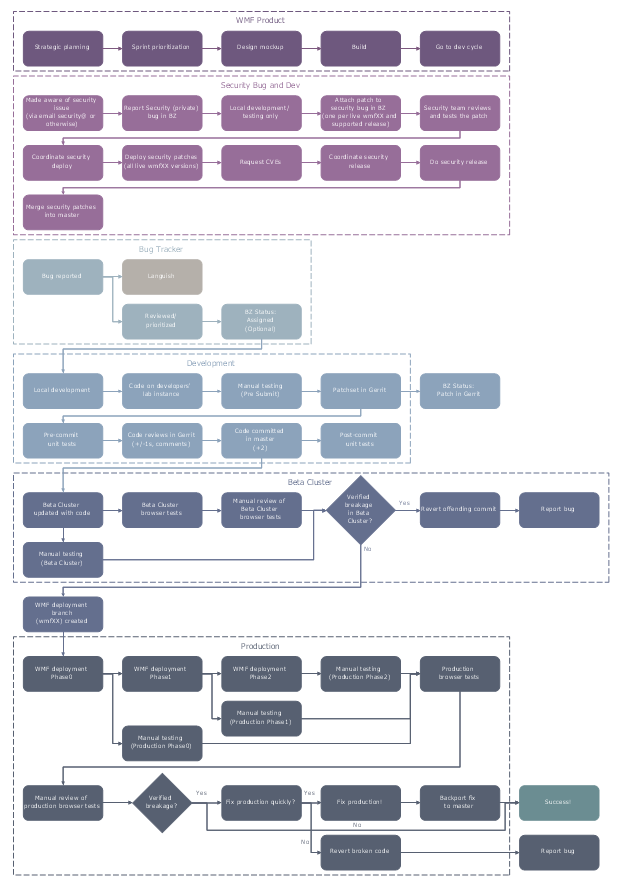
ConceptDraw DIAGRAM diagramming and vector drawing software offers the unique Business Process Mapping Solution from the Business Processes Area of ConceptDraw Solution Park. Powerful drawing tools of this solution make it effective Business Process Mapping software and help easy design professional looking business process diagrams and flowcharts.- Design elements - ER diagram (Chen notation) | Entity-Relationship ...
- Entity Relationship Diagram Examples | Quick YouTube Survey ...
- Block diagram - Document management system architecture | Block ...
- Best Vector Drawing Application for Mac OS X | Fault tree analysis ...
- Financial Trade UML Use Case Diagram Example | UML Use Case ...
- Mechanical Drawing Symbols | Electrical Symbols — Terminals and ...
- How to Add a Block Diagram to an MS Word ™ Document | 25 ...
- Financial Trade UML Use Case Diagram Example | UML Use Case ...
- Gantt Chart Software | Types of Flowcharts | How to Draw a Gantt ...
- Sport pictograms. Olympic Games | Flow Chart for Olympic Sports ...
- Sport pictograms. Olympic Games | Flow Chart for Olympic Sports ...
- How to Create a Timeline Diagram | How to Make a Timeline ...
- Active Directory diagram - Site links | How to Edit a Project Task List ...
- IP Subnet mask calculator - Template | Office pictograms - Vector ...
- Active Directory diagram - Site links | Design elements - Bank UML ...
- Meter indicators 2 - Vector stencils library | Design elements - Meter ...


