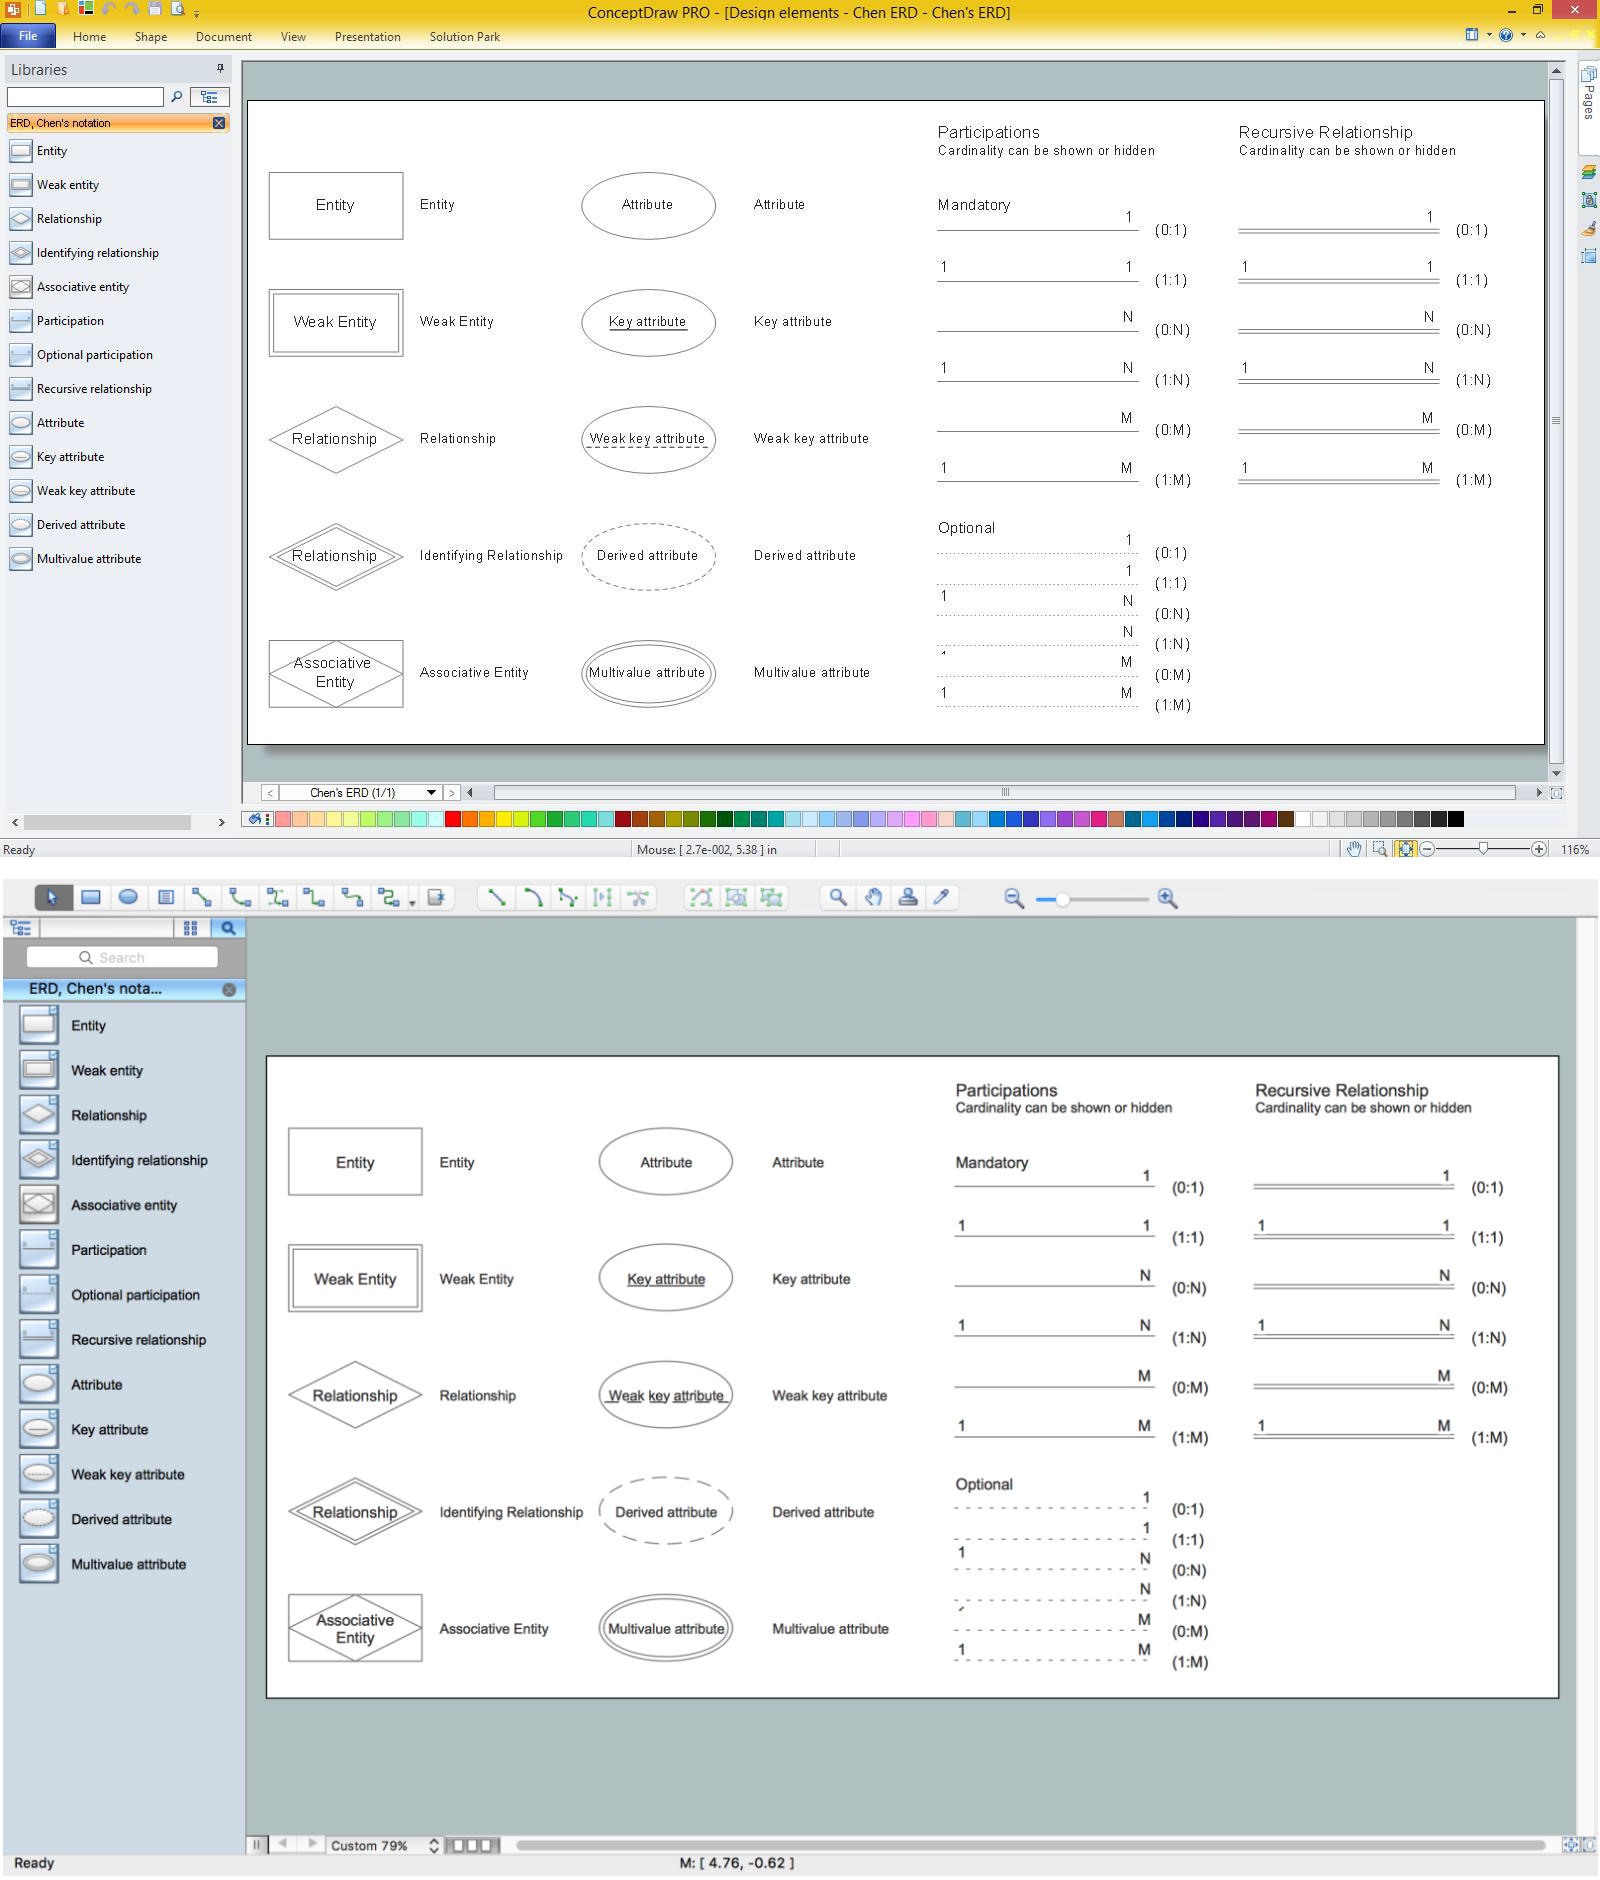
Design Element: Chen for Entity Relationship Diagram - ERD
Entity-Relationship Diagrams (ERDs) were developed and introduced as a convenient and visual tool for the data modeling, they are the perfect way for easy determining data and also relationships between them. The first standard notation for ERD was proposed by Chen. Chen's notation is very rich on the data modeling tools and standard notation symbols and elements for drawing easy understandable Entity-relationship diagrams, Attribute diagrams, Decomposition charts, which are especially popular for designing relational databases. The entity is the main term, it is a set of instances abstract or real objects with common characteristics or attributes. Any system's object is represented by one uniquely identified entity, relationships describe the links between the entities. ConceptDraw DIAGRAM diagramming software, which includes the Entity-Relationship Diagram (ERD) solution, offers all needed tools for professional drawing ER diagrams. Specially developed vector ERD design elements according to Chen and Crow's Foot notations are indispensible for professional ERDs design.
 Entity-Relationship Diagram (ERD)
Entity-Relationship Diagram (ERD) solution extends ConceptDraw DIAGRAM software with templates, samples and libraries of vector stencils from drawing the ER-diagrams by Chen's and crow’s foot notations.
 Metro Map
Metro Map solution extends ConceptDraw DIAGRAM software with templates, samples and library of vector stencils for drawing the metro maps, route maps, bus and other transport schemes, or design tube-style infographics.
 Metro Map
Metro Map solution extends ConceptDraw DIAGRAM software with templates, samples and library of vector stencils for drawing the metro maps, route maps, bus and other transport schemes, or design tube-style infographics.
 Entity-Relationship Diagram (ERD)
An Entity-Relationship Diagram (ERD) is a visual presentation of entities and relationships. That type of diagrams is often used in the semi-structured or unstructured data in databases and information systems. At first glance ERD is similar to a flowch
 ConceptDraw Solution Park
ConceptDraw Solution Park collects graphic extensions, examples and learning materials
 Rapid UML
Rapid UML solution extends ConceptDraw DIAGRAM software with templates, samples and libraries of vector stencils for quick drawing the UML diagrams using Rapid Draw technology.
Business Diagram Software
When managing the projects, people, or networks, there are daily designed and used different types of Business diagrams, so the powerful drawing software will be very useful for this. ConceptDraw DIAGRAM with large quantity of business solutions will meet your needs and will help you convey your ideas successful and rapidly, no matter are you professional or beginner. It is the best choice for business specialists and technical professionals who need quickly and easily explore, visualize, and communicate information. ConceptDraw DIAGRAM business diagram software is the most powerful business software and relational charting software. Create advanced, completely customizable Business Process Diagrams, Business Flow Charts, Work Flow Diagrams, Organizational Charts, Audit diagrams, Marketing diagrams, Value Stream Maps, TQM diagrams, ERD diagrams, EPC diagrams, Cause and Effect diagrams, Infographics, Dashboards, and other Relational business diagrams from your data using the powerful drawing tools of ConceptDraw Solution Park.
 Fishbone Diagram
Fishbone Diagrams solution extends ConceptDraw DIAGRAM software with templates, samples and library of vector stencils for drawing the Ishikawa diagrams for cause and effect analysis.
 Crystal Mapping
With Crystal Mapping all goals and relevant information can be observed in one radiant dashboard.
 Building Plans
Easily create the architectural and building engineering drawings: floor plans, restaurant plans, plans of building services, fire and emergency plans, furniture and equipment layouts.
- Entity-Relationship Diagram ( ERD ) | Metro Map | Fishbone Diagram ...
- Entity-Relationship Diagram ( ERD ) | Metro Map | Process Flowchart ...
- Entity-Relationship Diagram ( ERD ) | Metro Map | Wireless Networks ...
- Map Infographic Creator | Metro Map | Entity-Relationship Diagram ...
- Entity-Relationship Diagram ( ERD ) | Metro Map | Aerospace and ...
- Transport System Erd
- Aerospace and Transport | Entity-Relationship Diagram ( ERD ...
- Entity-Relationship Diagram ( ERD ) | Metro Map | Interactive Voice ...
- Entity-Relationship Diagram ( ERD ) | Metro Map | Metro Map | Class ...
- Entity-Relationship Diagram ( ERD ) | Metro Map | Interactive Voice ...
- Map Infographic Maker | Metro Map | Entity-Relationship Diagram ...
- Entity-Relationship Diagram ( ERD ) | Metro Map | How to Build Cloud ...
- Entity-Relationship Diagram ( ERD ) | Computer Network Diagrams ...
- Entity-Relationship Diagram ( ERD ) | eLearning for Skype | Metro ...
- Entity-Relationship Diagram ( ERD ) | SYSML | Metro Map | 20 ...
- Entity-Relationship Diagram ( ERD ) | Aerospace and Transport ...
- Entity-Relationship Diagram ( ERD ) | Metro Map | iPhone User ...
- Entity-Relationship Diagram ( ERD ) | Interactive Voice Response ...
- Entity-Relationship Diagram ( ERD ) | Interactive Voice Response ...
- Metro Map | Entity-Relationship Diagram ( ERD ) | Aerospace and ...

