ERD Symbols and Meanings
Entity Relationship Diagram (ERD) is a popular software engineering tool for database modeling and illustration the logical structure of databases, which uses one of two notations - Chen's or Crow’s Foot. Crow's foot notation is effective when used in software engineering, information engineering, structured systems analysis and design. Each of these notations applies its own set of ERD symbols. Crow's foot diagrams use boxes to represent entities and lines between these boxes to show relationships. Varied shapes at the ends of lines depict the cardinality of a given relationship. Chen's ERD notation is more detailed way to represent entities and relationships. ConceptDraw DIAGRAM application enhanced with all-inclusive Entity-Relationship Diagram (ERD) solution allows design professional ER diagrams with Chen's or Crow’s Foot notation on your choice. It contains the full set of ready-to-use standardized ERD symbols and meanings helpful for quickly drawing, collection of predesigned ERD samples, examples and templates. ConceptDraw Pro is a great alternative to Visio for Mac users as it offers more features and can easily handle the most demanding professional needs.
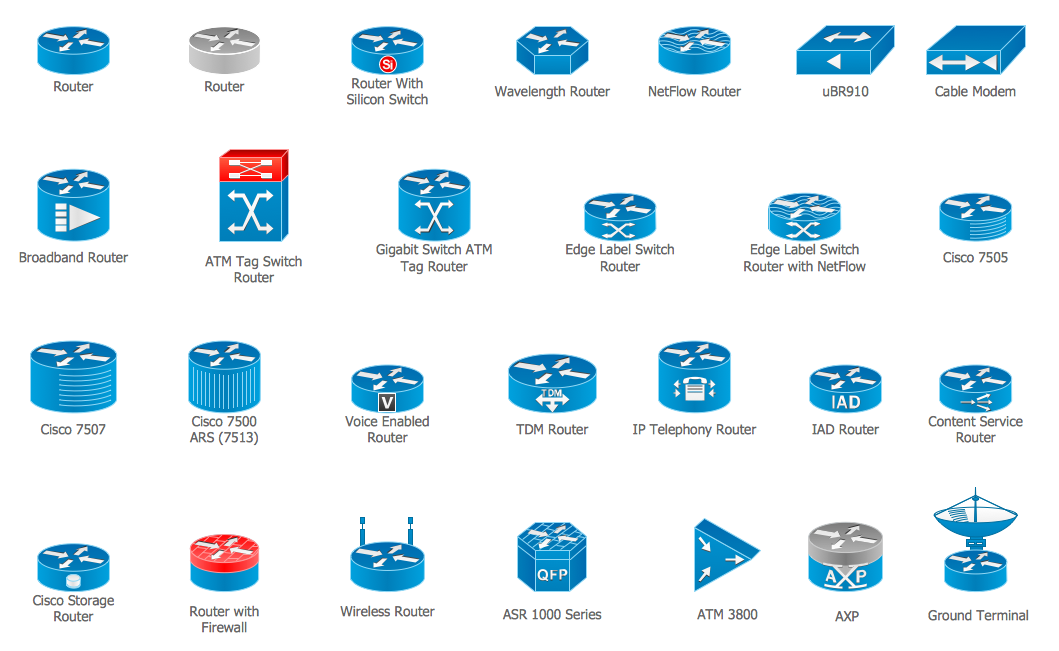
Cisco Routers. Cisco icons, shapes, stencils and symbols
Network infrastructure planning is a very important process in the network construction, and the share of time allocated to this within the scope of the entire project may reach 60-80%. A competent and thorough approach to planning contributes to the quick investment return, and also increases the reliability and flexibility of the final system, reducing the probability of additional costs related to the incorrect implementation. Any planning begins with an analysis of the business requirements to the final system. Basic network parameters, which should be assessed are the scalability, accessibility, cost, speed and safety. Speed and cost are often mistaken for the most important parameters, and the rest of the parameters aren't even remembered. This is not entirely correct. Initially, it is necessary to assess the business plans for the future, because sometimes it is more profitable to invest more money in the beginning. If the business is to develop, then, consequently, demands onUML Use Case Diagram. Design Elements
UML Use Case Diagrams are used to illustrate the structure of arbitrarily complex systems and illustrates the service consumer - service provider relationship between components.
- Entity Relationship Diagram Symbols | Data Flow Diagram Symbols ...
- Entity Relationship Diagram Symbols and Meaning ERD Symbols ...
- Mechanical Drawing Symbols | Entity Relationship Diagram ...
- Basic Flowchart Symbols and Meaning | Entity Relationship ...
- Data Flow Diagram Symbols . DFD Library | Basic Flowchart ...
- Basic Flowchart Symbols and Meaning | Entity Relationship ...
- Components of ER Diagram | Entity Relationship Diagram Software ...
- Entity Relationship Diagram Symbols | Process Flowchart | How To ...
- Data Flow Diagram Symbols . DFD Library | Mechanical Drawing ...
- Building Drawing Software for Design Office Layout Plan ...
- Mechanical Drawing Symbols | Workflow Diagram Symbols | Entity ...
- Entity Relationship Diagram Software for Design Crows Foot ER ...
- Basic Flowchart Symbols and Meaning | Process Flowchart | Entity ...
- Flowchart design. Flowchart symbols , shapes, stencils and icons ...
- Basic Flowchart Symbols and Meaning | Flowchart design ...
- Process Flowchart | Basic Flowchart Symbols and Meaning | IDEF0 ...
- Basic Flowchart Symbols and Meaning | UML Use Case Diagram ...
- Cross-Functional Flowchart | Process Flowchart | Basic Flowchart ...
- Basic Flowchart Symbols and Meaning | Process Flowchart ...
- Flow Chart Symbols | Entity Relationship Diagram Symbols | Basic ...


