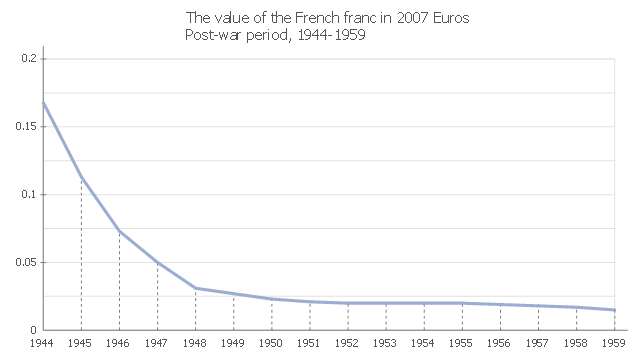
This line graph sample depicts the value of the old French franc in the post-war period, in 2007 Euros. It was designed on the base of the Wikimedia Commons file: FrancEuro1944-1959.png [commons.wikimedia.org/ wiki/ File:FrancEuro1944-1959.png].
This file is licensed under the Creative Commons Attribution-Share Alike 3.0 Unported license.
[creativecommons.org/ licenses/ by-sa/ 3.0/ deed.en]
"The franc (sign: F, commonly also FF or Fr) was a currency of France. Between 1360 and 1641, it was the name of coins worth 1 livre tournois and it remained in common parlance as a term for this amount of money. It was re-introduced (in decimal form) in 1795 and remained the national currency until the introduction of the euro in 1999 (for accounting purposes) and 2002 (coins and banknotes). It was a commonly held international reserve currency in the 19th and 20th centuries." [French franc. Wikipedia]
The line chart example "The value of the French franc in 2007 Euros" was created using the ConceptDraw PRO diagramming and vector drawing software extended with the Basic Line Graphs solution from the Graphs and Charts area of ConceptDraw Solution Park.
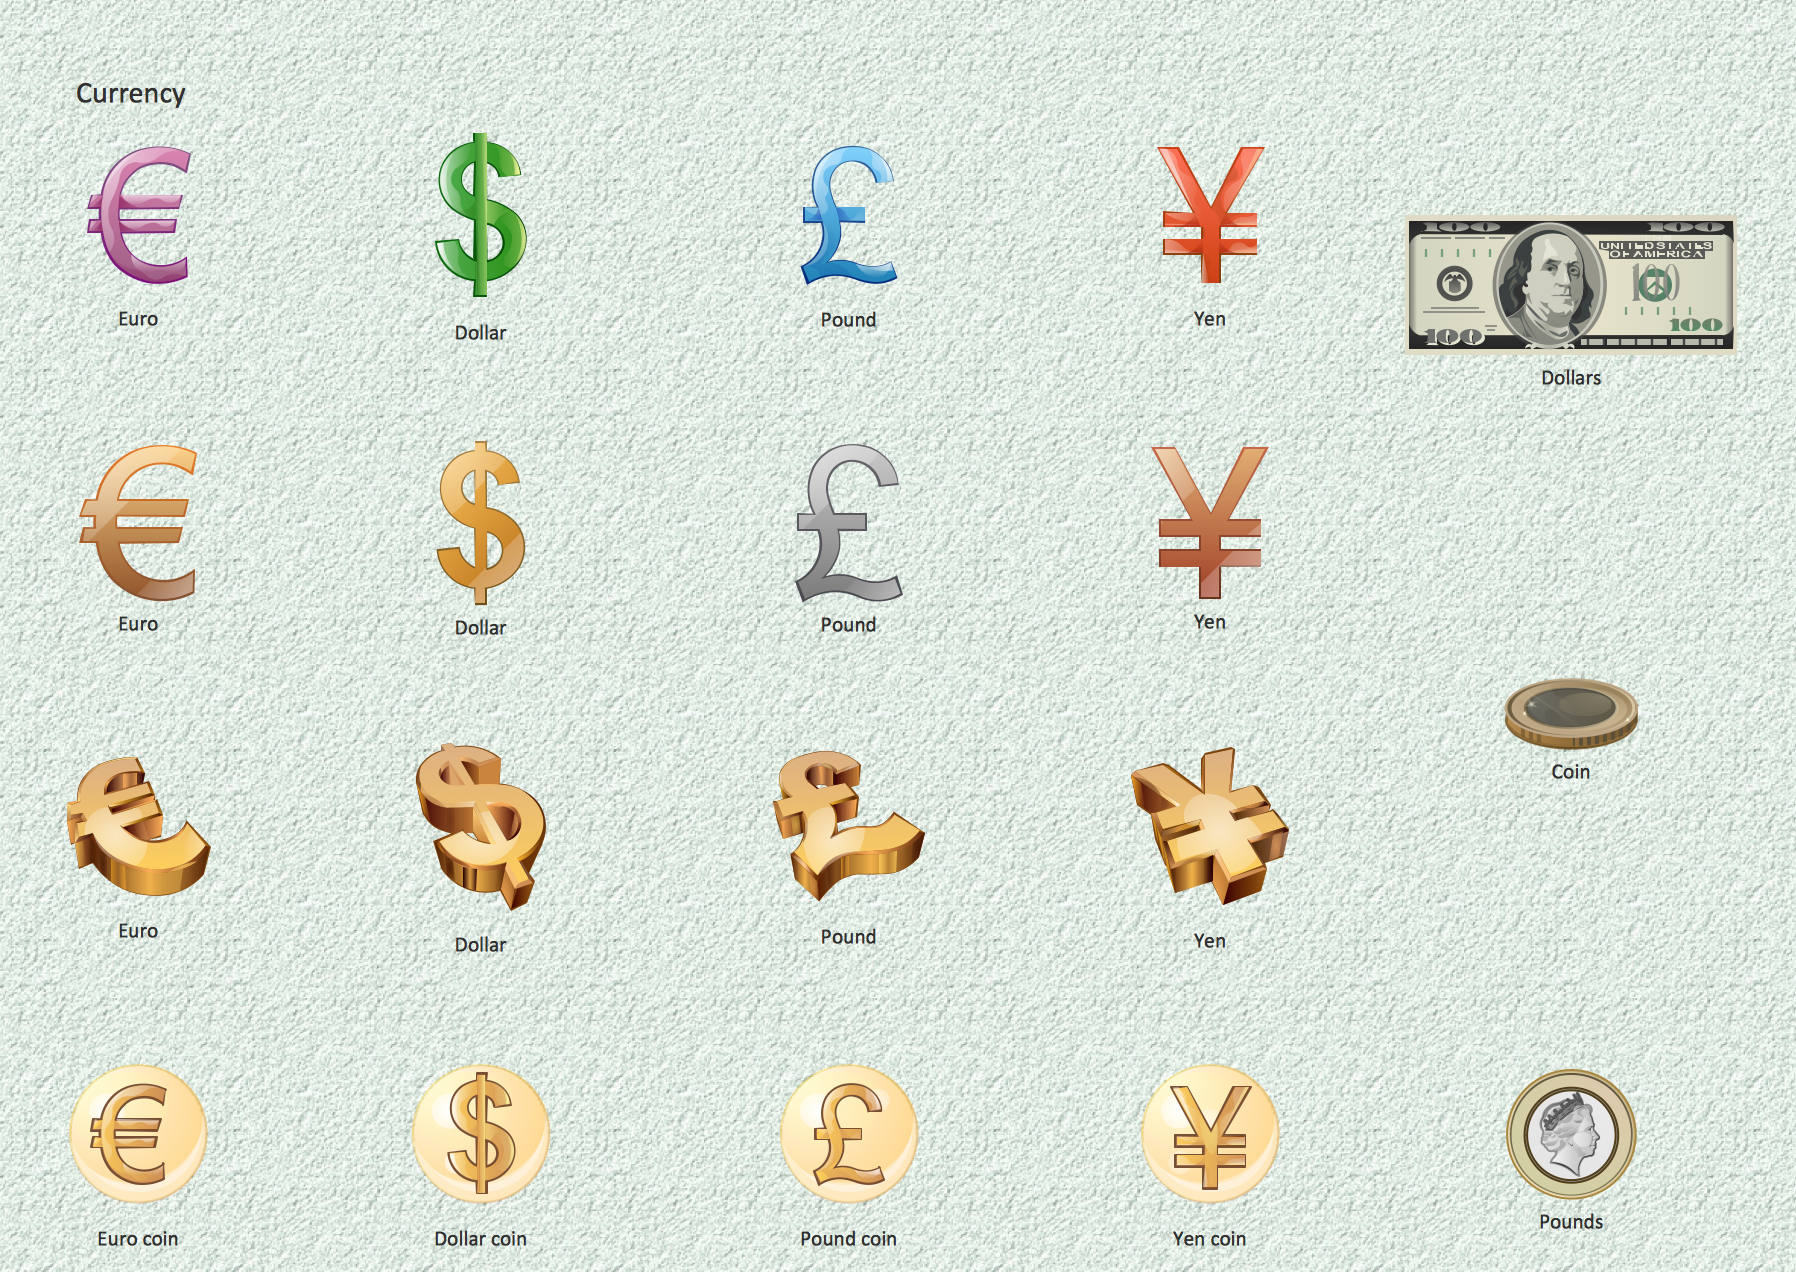
The vector stencils library "Currency" contains 28 currency and money icons.
Use it to design your business and finance illustrations and infographics with ConceptDraw PRO diagramming and vector drawing software.
The vector stencils library "Currency" is included in the Business and Finance solution from the Illustration area of ConceptDraw Solution Park.
Use it to design your business and finance illustrations and infographics with ConceptDraw PRO diagramming and vector drawing software.
The vector stencils library "Currency" is included in the Business and Finance solution from the Illustration area of ConceptDraw Solution Park.
Registered unemployment rate in Europe (EU-27) - september 2010. Data from Portal Euro-Indicators on EU Commission website (Eurostat). [epp.eurostat.ec.europa.eu/ portal/ page/ portal/ euroindicators/ peeis]
"Eurostat, the statistical office of the European Union, defines unemployed as those persons age 15 to 74 who are not working, have looked for work in the last four weeks, and ready to start work within two weeks, which conform to ILO standards. Both the actual count and rate of unemployment are reported. Statistical data are available by member state, for the European Union as a whole (EU27) as well as for the euro area (EA16). Eurostat also includes a long-term unemployment rate. This is defined as part of the unemployed who have been unemployed for an excess of 1 year.
The main source used is the European Union Labour Force Survey (EU-LFS). The EU-LFS collects data on all member states each quarter. For monthly calculations, national surveys or national registers from employment offices are used in conjunction with quarterly EU-LFS data. The exact calculation for individual countries, resulting in harmonized monthly data, depend on the availability of the data." [Unemployment. Wikipedia]
This example Registered unemployment rate in Europe (EU-27) - september 2010 was redesigned from the Wikimedia Commons file: Unemployment European Union 2010M09.svg.
[commons.wikimedia.org/ wiki/ File:Unemployment_ European_ Union_ 2010M09.svg]
This file is licensed under the Creative Commons Attribution-Share Alike 3.0 Unported license. [creativecommons.org/ licenses/ by-sa/ 3.0/ deed.en]
The thematic map example "Registered unemployment rate in Europe (EU-27) - september 2010" was created using the ConceptDraw PRO diagramming and vector drawing software extended with the Continent Map solution from the Maps area of ConceptDraw Solution Park.
Chart Examples
Easy charting software comes with beautiful chart templates and examples. This makes it easy to create professional charts without prior experience.Currency - Design Elements
Take a look which samples and templates of currency (paper money and coins symbols and illustrations) we have prepared for you. Program libraries contain vector cliparts elements for drawing the Currency Illustrations and plenty pictures with Money thematics.This vector stencils library contains 195 cloud computing icons.
Use it to design cloud computing infographic and diagrams with ConceptDraw PRO software.
"Cloud computing, also on-demand computing, is a kind of Internet-based computing that provides shared processing resources and data to computers and other devices on demand. It is a model for enabling ubiquitous, on-demand access to a shared pool of configurable computing resources (e.g., networks, servers, storage, applications and services), which can be rapidly provisioned and released with minimal management effort. Cloud computing and storage solutions provide users and enterprises with various capabilities to store and process their data in third-party data centers.
Cloud computing has become a highly demanded service or utility due to the advantages of high computing power, cheap cost of services, high performance, scalability, accessibility as well as availability." [Cloud computing. Wikipedia]
The vector stencils library "Cloud clipart" is included in the Cloud Computing Diagrams solution from the Computer and Networks area of ConceptDraw Solution Park.
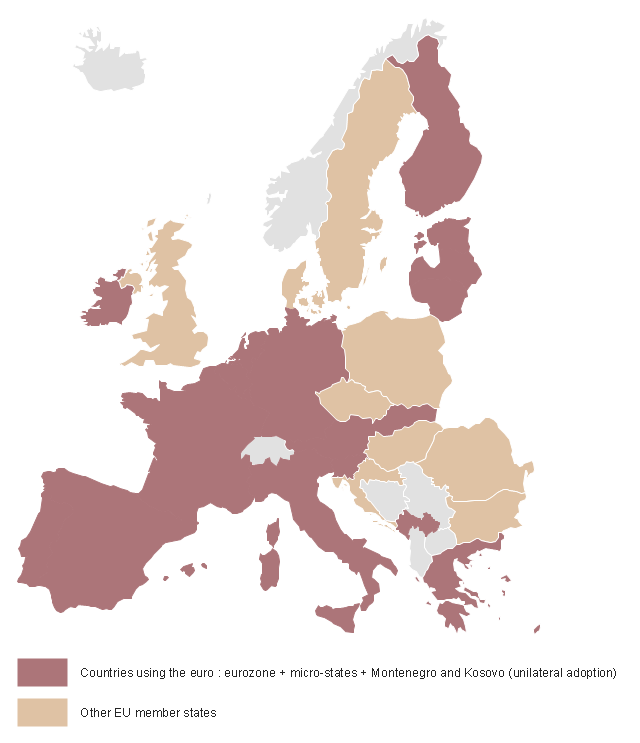
This Germany political map example was created on the base of Wikimedia Commons file: BlueEurozone.svg. [commons.wikimedia.org/ wiki/ File:BlueEurozone.svg]
"The eurozone, officially called the euro area, is a monetary union of 19 of the 28 European Union (EU) member states which have adopted the euro (€) as their common currency and sole legal tender. The other nine members of the European Union continue to use their own national currencies.
The eurozone consists of Austria, Belgium, Cyprus, Estonia, Finland, France, Germany, Greece, Ireland, Italy, Latvia, Lithuania, Luxembourg, Malta, the Netherlands, Portugal, Slovakia, Slovenia, and Spain." [Eurozone. Wikipedia]
The political map example "Map of Germany in Eurozone" was designed using the ConceptDraw PRO software extended with the Map of Germany solution from the Maps area of ConceptDraw Solution Park.
















---september-2010.png--diagram-flowchart-example.png)



-cloud-clipart---vector-stencils-library.png--diagram-flowchart-example.png)
-cloud-clipart---vector-stencils-library.png--diagram-flowchart-example.png)


-cloud-clipart---vector-stencils-library.png--diagram-flowchart-example.png)


-cloud-clipart---vector-stencils-library.png--diagram-flowchart-example.png)
-cloud-clipart---vector-stencils-library.png--diagram-flowchart-example.png)


