HelpDesk
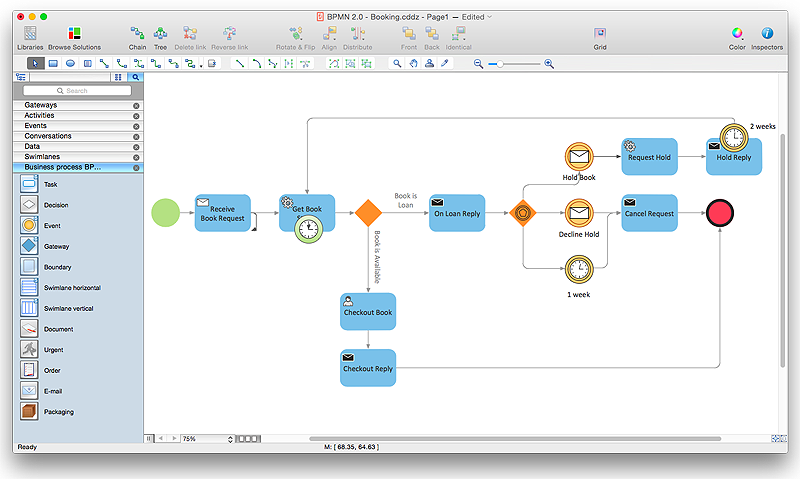
How to Create a BPMN Diagram Using ConceptDraw PRO
Business Process Modeling Notation (BPMN) is a method of illustrating business processes in the form of a diagram. The most effective method of creating or analyzing a business process is to visually interpret the steps using a business process diagram, flowchart or workflow. This is known as business process modeling, and will be performed within a company by a team who have detailed knowledge of company process, and analysts with expertise in the modeling discipline. The objective is often to increase production or lower costs — by modeling the process initially using a flowchart, inefficiencies and problems can be spotted before committing to a decision or strategy. You can create BPMN diagrams using the ConceptDraw PRO diagramming tools. ConceptDraw have designed a solution that combines BPMN v2.0 methodology and graphical notification into one powerful package. The Business Process Diagrams solution from ConceptDraw Solution Park provides a comprehensive collection of vector
 Fire and Emergency Plans
This solution extends ConceptDraw software with samples, templates and design elements for drawing the Fire and Emergency Plans.
HelpDesk
How to Create a Timeline Diagram in ConceptDraw PRO
A Timeline is a chart which displays a project plan schedule in chronological order. A Timeline is used in project management to depict project milestones and visualize project phases, and show project progress. The graphic form of a timeline makes it easy to understand critical project milestones, such as the progress of a project schedule. Timelines are particularly useful for project scheduling or project management when accompanied with a Gantt chart. It captures the main of what the project will accomplish and how it will be done. making a project timeline is one of the most important skills a project manager needs have. Making comprehensive, accurate timelines allows you getting every project off in the best way. ConceptDraw PRO allows you to draw a timeline charts using special library.
 Target and Circular Diagrams
This solution extends ConceptDraw PRO software with samples, templates and library of design elements for drawing the Target and Circular Diagrams.
 Stakeholder Onion Diagrams
The Stakeholder Onion Diagram is often used as a way to view the relationships of stakeholders to a project goal. A basic Onion Diagram contains a rich information. It shows significance of stakeholders that will have has influence to the success achieve
HelpDesk
How to Draw an Organizational Chart Using ConceptDraw PRO
The organizational chart software is a valuable tool for modern business. It is important for any business to build a clear organizational structure that determines the responsibilities and relationships between different positions in the organization. The clear structured organization - means the clear structured business workflow, which is the core of success in the business. ConceptDraw PRO is an org chart software that allows you to draw an organizational structure of your company quickly and easily.HelpDesk
How to Draw a Fishbone Diagram with ConceptDraw PRO
Fishbone (Ishikawa) Diagram is often used in business to determine the cause of some problem. A Fishbone diagram is also called cause-and-effect diagram.The main goal of the Fishbone diagram is to illustrate in a graphical way the relationship between a given outcome and all the factors that influence this outcome. The complete diagram resembles a fish skeleton as its name implies. Cause and Effect analysis is used in management to identify the possible causes of a problem in order to eliminate them. The ability to create a Fishbone Diagram is supported by the Fishbone Diagram solution.Think. Act. Accomplish.
ConceptDraw MINDMAP is ready to provide you with mind mapping tool which can serve as comprehensive productivity tool for your business.- Business Processes | Event -driven process chain (EPC) diagram ...
- Emergency Plan | How to Create a Seating Chart for Wedding or ...
- Emergency Plan | Fire safety equipment - Vector stencils library ...
- Schedule pie chart - Daily action plan | Chart Templates | Business ...
- Process Flowchart | Event -driven Process Chain Diagrams EPC ...
- Emergency Plan | Emergency Action Plan Template | Fire Exit Plan ...
- Bar Diagrams for Problem Solving. Create event management bar ...
- Example Of Fire Safety Plan
- Process Flowchart | Event -driven Process Chain Diagrams EPC ...
- Chart Examples | Event -driven Process Chain Diagrams EPC | How ...
- PERT chart - Project management plan
- Fire Safety Plan Sample
- Diagram Of A Business Plan
- How To Draw Building Plans | Emergency Plan | How to Create a ...
- Fire and Emergency Plans | Emergency Plan | How To Create ...
- Emergency Plan | Fire Evacuation Plan Template | How To Create ...
- Emergency Plan | Fire Exit Plan | Emergency Action Plan Template ...
- Symbol Of Action Plan
- Fire and Emergency Plans | Emergency Plan | How To Create ...
- Emergency Plan | Fire Exit Plan . Building Plan Examples | Design ...


