 SWOT and TOWS Matrix Diagrams
SWOT and TOWS Matrix Diagrams solution extends ConceptDraw DIAGRAM and ConceptDraw MINDMAP software with features, templates, samples and libraries of vector stencils for drawing SWOT and TOWS analysis matrices and mind maps.
SWOT Sample in Computers
SWOT analysis is an effective method of making the plan for evaluation the Strengths, Weaknesses, Opportunities, and Threats that are involved in a project. It is actively applied in business sphere and helps define the objective of the project. It lets detect and represent the external and internal causes for the accomplishing the project goals and business purposes, and also plays important role in formation successful and perspective business. ConceptDraw DIAGRAM is a perfect diagramming software which nicely suits for SWOT analysis and representation its results in the form of SWOT diagrams of different complexity and design, thanks to the included SWOT and TOWS Matrix Diagrams solution from Management area of ConceptDraw Solution Park. This solution contains a lot of specially designed SWOT templates, SWOT matrix samples (SWOT analysis sample, SWOT sample in computers, SWOT matrix for business sphere, SWOT matrix educational, and many others), and also ready SWOT matrix objects that allow users create their own SWOT diagrams in minutes.Think. Act. Accomplish.
ConceptDraw MINDMAP is ready to provide you with mind mapping tool which can serve as comprehensive productivity tool for your business.
 Management Area
The solutions from Management area of ConceptDraw Solution Park collect templates, samples and libraries of vector stencils for drawing the management diagrams and mind maps.
HelpDesk
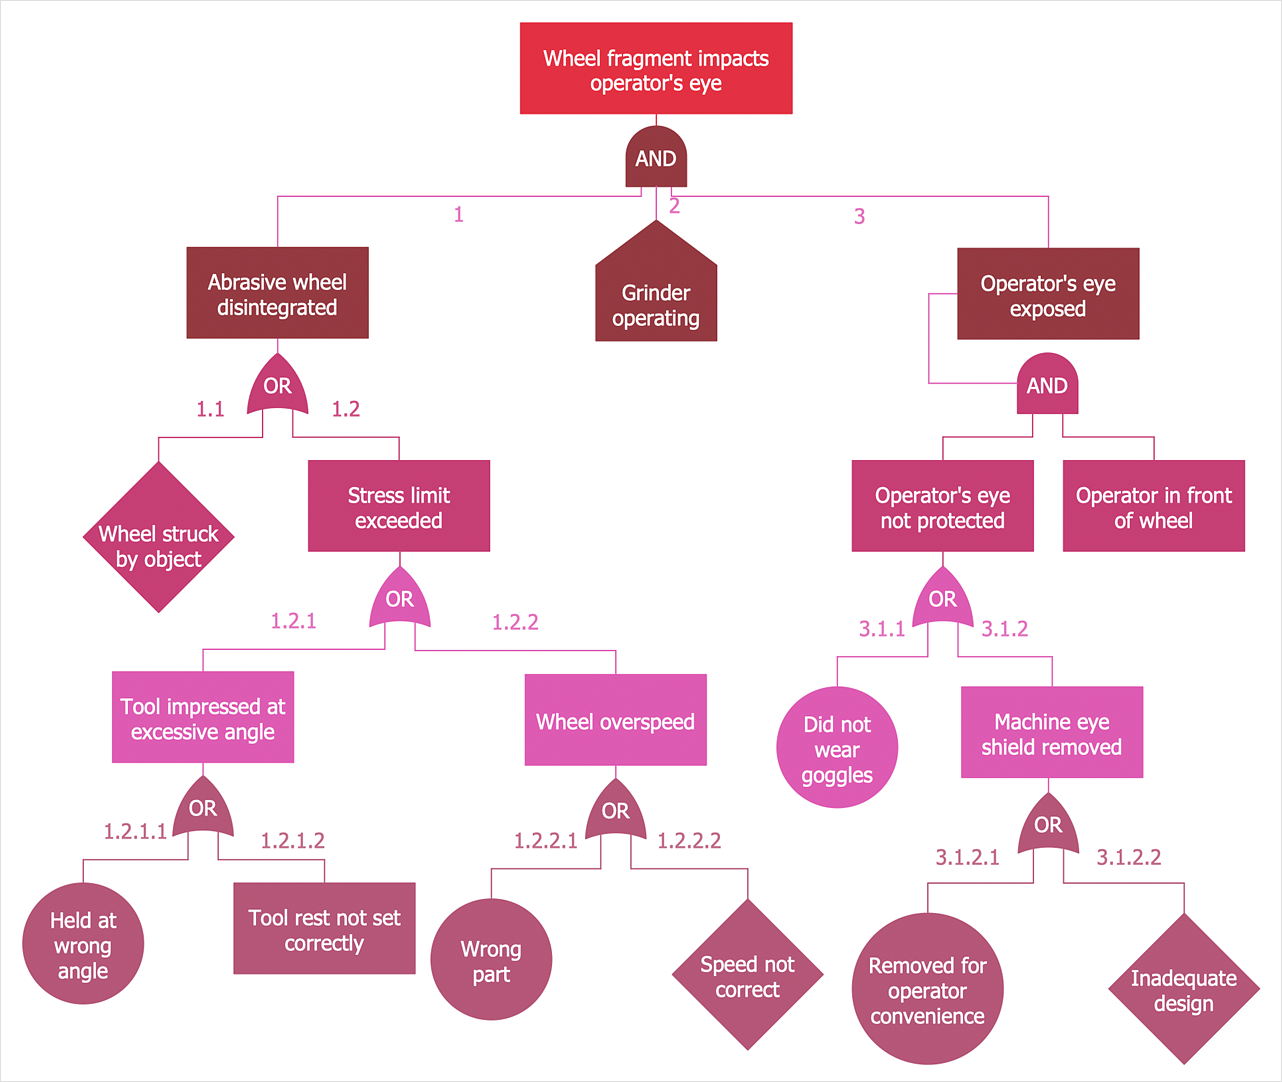
How to Create a Fault Tree Analysis Diagram (FTD)
Fault Tree Diagram is a logic diagram that shows the state of an entire system in a relationship of the conditions of its elements. Fault Tree Diagram is used to analyze the probability of functional system failures and safety accidents. ConceptDraw DIAGRAM allows you to create professional Fault Tree Diagrams using the basic FTD symbols. An FTD visualizes a model of the processes within a system that can lead to the unlikely event. A fault tree diagrams are created using standard logic symbols. The basic elements in a fault tree diagram are gates and events.
 Event-driven Process Chain Diagrams
Event-Driven Process Chain Diagrams solution extends ConceptDraw DIAGRAM functionality with event driven process chain templates, samples of EPC engineering and modeling the business processes, and a vector shape library for drawing the EPC diagrams and EPC flowcharts of any complexity. It is one of EPC IT solutions that assist the marketing experts, business specialists, engineers, educators and researchers in resources planning and improving the business processes using the EPC flowchart or EPC diagram. Use the EPC solutions tools to construct the chain of events and functions, to illustrate the structure of a business process control flow, to describe people and tasks for execution the business processes, to identify the inefficient businesses processes and measures required to make them efficient.
 ConceptDraw Solution Park
ConceptDraw Solution Park collects graphic extensions, examples and learning materials
 Fault Tree Analysis Diagrams
This solution extends ConceptDraw DIAGRAM.5 or later with templates, fault tree analysis example, samples and a library of vector design elements for drawing FTA diagrams (or negative analytical trees), cause and effect diagrams and fault tree diagrams.
 Entity-Relationship Diagram (ERD)
Entity-Relationship Diagram (ERD) solution extends ConceptDraw DIAGRAM software with templates, samples and libraries of vector stencils from drawing the ER-diagrams by Chen's and crow’s foot notations.
 Business Productivity Area
Business Productivity Solutions extend ConceptDraw products with tools for making presentations, conducting meetings, preparing documents, brainstorming, or building new strategies.
- Swot Analysis Example For Event
- SWOT Analysis | Management | Business Productivity Area | Swot ...
- Event -driven Process Chain Diagrams EPC | SWOT analysis ...
- Matrices | Value Stream Mapping | Event -driven Process Chain ...
- Swot Analysis Sample For An Event
- SWOT analysis for a small independent bookstore | Entity ...
- SWOT analysis for a small independent bookstore | SWOT Analysis ...
- Fishbone Diagram | Event -driven Process Chain Diagrams EPC ...
- SWOT Analysis | Business Productivity Area | Flow Chart Definition ...
- Fault Tree Analysis Diagrams | ConceptDraw Solution Park | SWOT ...
- Porter's value chain matrix diagram | Event -driven Process Chain ...
- Event -driven Process Chain Diagrams EPC | Value Stream Mapping ...
- Porter's value chain matrix diagram | Event -driven Process Chain ...
- Fishbone Diagram | Event -driven Process Chain Diagrams EPC ...
- Fishbone Diagram | Entity-Relationship Diagram (ERD) | Event ...
- Marketing Diagrams | Process Flowchart | Bar Diagrams for Problem ...
- Structuring a business process as a chain of events and functions ...
- Analysis Diagram Examples
- Epc Sample Ppt


