How To Use Skype for Business
Using Skype for Business will let you control teams and deliver information worldwide in a real-time. This is an important tool for everyday work.
What is Gantt Chart (historical reference)
Historical reference about the Gantt chart.Project — Working With Costs
ConceptDraw PROJECT delivers a rich set of built-in functionalities and optional product extensions that support your daily workflow in time-saving and creative ways. This video lesson will teach you how to work with costs in your project document.HelpDesk
How to Add a Mind Map into a Given Notebook in Your Evernote Storage
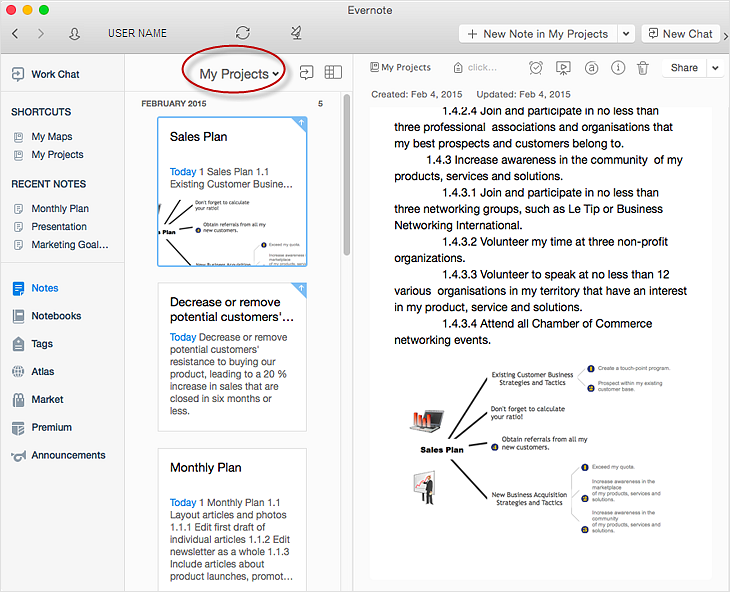
The Note Exchange solution lets you to add a content, created with ConceptDraw MINDMAP to any of your Evernote's notebooks.Remote Projects in Corporate Strategy
Communication is the main challenge and the key success factor for organizational project management in company with remote projects. Communicating visually via Skype you bring all projects together to achieve corporate goals.
HelpDesk
How to Change the Timescale in a Gantt Chart View
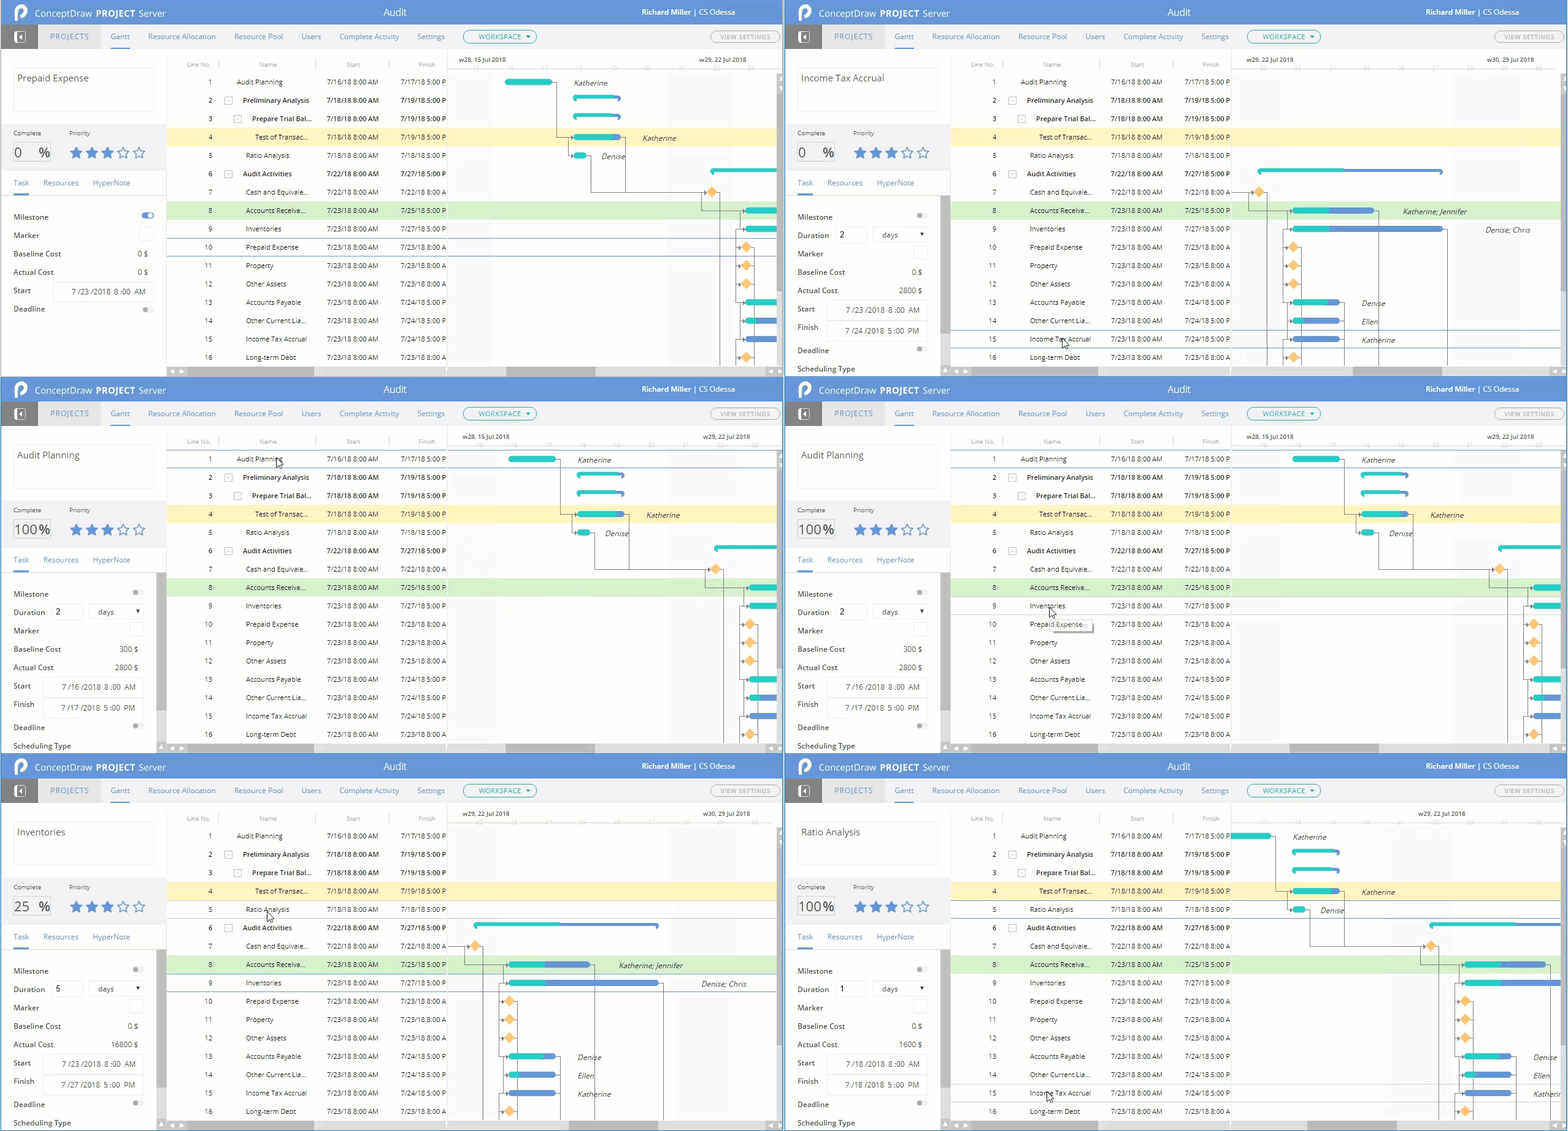
Most views in ConceptDraw PROJECT Server have a timescale that shows the units of project time measurement (hour, day, week, etc.) used to schedule project tasks. You can change the timescale to view smaller or bigger time units, from hours all the way up to years. For example, you may want to show time in quarterы of the yearб or you may want to show a Gantt chart across months and days.Gantt chart examples
All Gantt charts were made using ConceptDraw PROJECT. ConceptDraw PROJECT works both on Windows and Mac OS X. It allows to schedule a voluntary number of projects in a single Workspace document and lets easily share tasks and resources among them. ConceptDraw PROJECT shares files among Windows and Mac OS X.How to Create Gantt Chart
To begin managing a new project, you will need to define the individual Tasks that must be completed to deliver it. The default view for a new project in ConceptDraw PROJECT is the Gantt Chart.How to Report Task's Execution with Gantt Chart
ConceptDraw PROJECT’s powerful reporting engine lets you generate a set of tabular reports with just one click, or visualize your project as Radial Tasks Structures, Work Breakdown Structures and Resource Calendars. It also provides you with dynamic Project Dashboards.HelpDesk
How to Add a Color Marker to Project Task on a Gantt Chart
ConceptDraw PROJECT Server allows adding color markers to scheduled project tasks. A color marker is used to show whether a task is marked for further action or identification of some kind. You can use markers if you want to select certain tasks for further viewing, filtering, formatting, or editing in the offline mode.- Launch Projects Exchanging Mind Maps with Evernote | Create a ...
- Successful Strategic Plan | What is Gantt Chart (historical reference ...
- Note Exchange | How to Send a Mind Map to Evernote | The Mind ...
- Successful Strategic Plan | Build Strategies Exchanging Mind Maps ...
- Preparation for a Trip | Take Notes Exchanging Mind Maps with ...
- How to Make a Project Tasks Mind Map from Brainstorm | How to ...
- Evernote Template
- Product Overview | What can you create with ConceptDraw ...
- Gantt Chart E


