UML Use Case Diagram Example. Registration System
This sample was created in ConceptDraw DIAGRAM diagramming and vector drawing software using the UML Use Case Diagram library of the Rapid UML Solution from the Software Development area of ConceptDraw Solution Park. This sample shows the types of user’s interactions with the system and is used at the registration and working with the database system.
 Rapid UML
Rapid UML solution extends ConceptDraw DIAGRAM software with templates, samples and libraries of vector stencils for quick drawing the UML diagrams using Rapid Draw technology.
Entity Relationship Diagram Software Engineering
Entity Relationship Diagram (aka ER Diagram, E-R Diagram, ERD) is a time-tested and widespread software development and software engineering method for data modeling, illustrating the logical structure of databases and system design. For ERDs construction are used three basic elements: entities, attributes, and relationships. Chen's notation for ERD supposes the use of rectangles (boxes) to represent entities and diamonds to depict relationships between first-class objects. This notation is popular when creating conceptual data models of information systems. Another standardized notation for ER diagrams is Crow's foot notation. ConceptDraw DIAGRAM as a powerful Entity Relationship Diagram software engineering provides the tools of Entity-Relationship Diagram (ERD) solution from Software Development area of ConceptDraw Solution Park for instantly describing databases using ERDs of Crow’s Foot and Chen’s notations. Use the predesigned vector elements for both these notations from 2 libraries included to Entity-Relationship Diagram (ERD) solution.Business process Flow Chart — Event-Driven Process chain (EPC) diagrams
Event-Driven Process chain Diagrams for improvement throughout an organisation. Best software for Process Flow Diagram. The Event-driven Process Chain (EPC) Diagrams allows managers to plan processes and resources.Gane Sarson Diagram
The Gane-Sarson methodology uses the graphical techniques for building the logical models for the systems. It is helpful for analysts and designers to make common and clear picture of the system, to depict all its processes and how they transform the data. The Gane-Sarson methodology lets represent all this information in a way understandable for the users and other interested people, and gives the possibility to see instantly how the system's parts serve together to meet their needs. This methodology supposes the building of a system top-down. First you need create an overall system data flow, then determine the details of the data structures, the process logic and design the modular structures. ConceptDraw DIAGRAM diagramming and vector drawing software offers the Data Flow Diagrams solution with Gane-Sarson Notation library rich for the specific symbols of the Gane-Sarson notation. All they are vector and fully ready-to-use for drawing the Data Flow Diagrams, which will be then successfully used in presentations, websites, and various business documents.WLAN
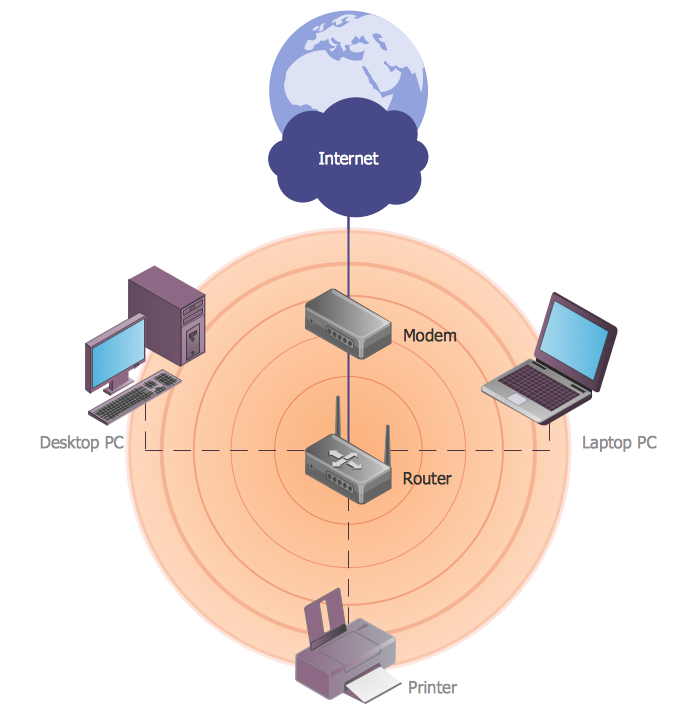
ConceptDraw DIAGRAM diagramming and vector drawing software extended with Wireless Networks Solution gives the ability to its users to create professional looking WLAN schemes and diagrams quick and easy.
 Computer and Network Package
Computer and Network Package is a large set of valuable graphical solutions from ConceptDraw Solution Park, developed and specially selected to help computer network specialists and IT professionals to realize their daily work the most efficiently and quickly. This package contains extensive set of graphic design tools, ready-to-use vector elements, built-in templates and samples for designing professional-looking diagrams, charts, schematics and infographics in a field of computer network technologies, cloud computing, vehicular networking, wireless networking, ensuring networks security and networks protection. It is useful for designing different floor plans and layout plans for homes, offices, hotels and instantly construction detailed schemes of computer networks and wireless networks on them, for making professional-looking and colorful Pie Charts, Bar Graphs and Line Charts visualizing the relevant information and data.
- Usecase Diagram For Exam Registration
- UML Use Case Diagram Example Registration System | Data Flow ...
- Use Case Diagram For Exam Registration System
- Exam Registration System Chart Diagram
- Class Diagram For Exam Registration System
- UML Use Case Diagram Example Registration System | Event ...
- Uml Diagram And Of Exam Registration With Relationships
- Exam Registration System Uml Diagrams
- UML Use Case Diagram Example Registration System | Account ...


