Block Diagram Software
The popularity of Block Diagrams grows day by day. The existence of powerful software for their design is an excellent news! ConceptDraw DIAGRAM Block Diagram Software offers the Block Diagrams Solution from the "Diagrams" Area.Flowchart Components
The ConceptDraw Flowchart component includes a set of samples and templates. This geathered as flowchart maker toolbox which focused on drawing flowcharts of any industry standards.Entity Relationship Diagram Software Engineering
Entity Relationship Diagram (aka ER Diagram, E-R Diagram, ERD) is a time-tested and widespread software development and software engineering method for data modeling, illustrating the logical structure of databases and system design. For ERDs construction are used three basic elements: entities, attributes, and relationships. Chen's notation for ERD supposes the use of rectangles (boxes) to represent entities and diamonds to depict relationships between first-class objects. This notation is popular when creating conceptual data models of information systems. Another standardized notation for ER diagrams is Crow's foot notation. ConceptDraw DIAGRAM as a powerful Entity Relationship Diagram software engineering provides the tools of Entity-Relationship Diagram (ERD) solution from Software Development area of ConceptDraw Solution Park for instantly describing databases using ERDs of Crow’s Foot and Chen’s notations. Use the predesigned vector elements for both these notations from 2 libraries included to Entity-Relationship Diagram (ERD) solution.IDEF0 Software
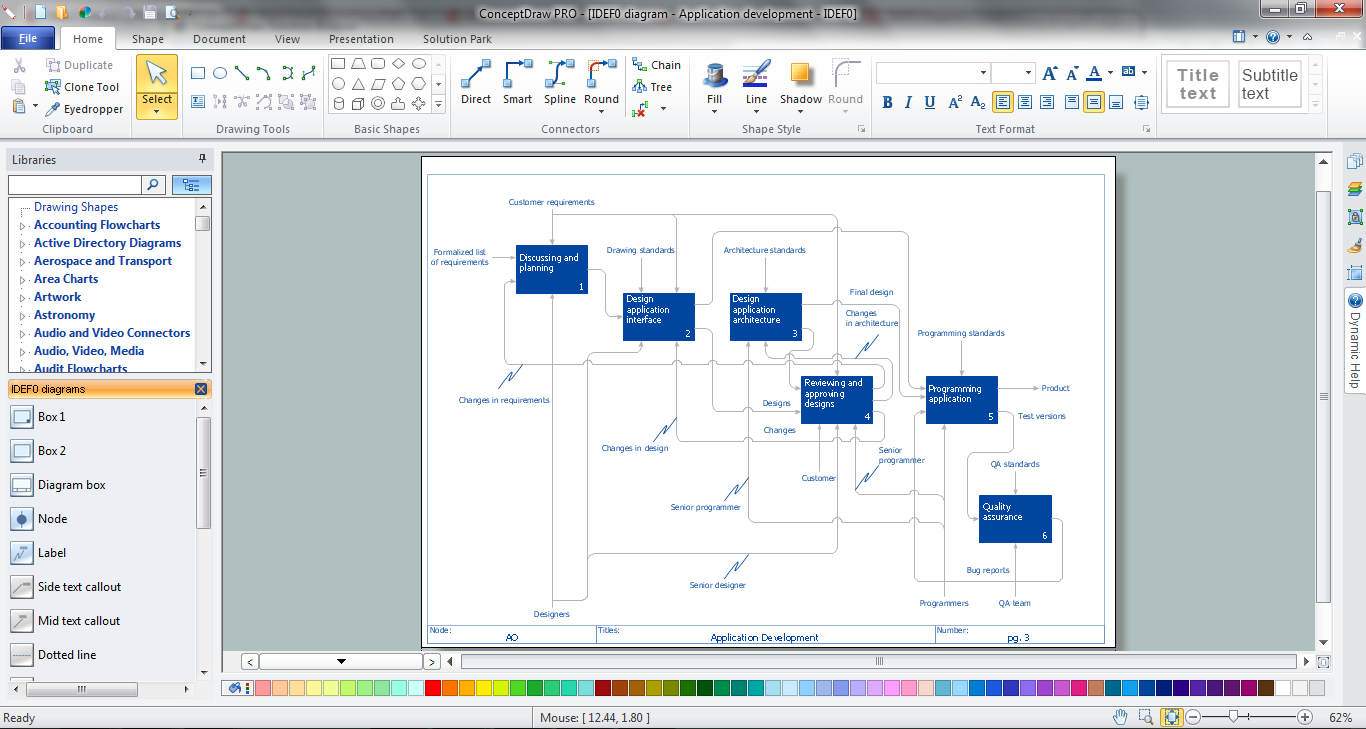
ConceptDraw DIAGRAM diagramming and vector drawing application is a powerful IDEF0 software thanks to the IDEF0 Diagrams solution from the Software Development area of ConceptDraw Solution Park.Flowchart Software
The Flowcharts are popular and widely used for designing, documenting, managing and analyzing the complex processes and programs in various fields, such as science, business, engineering, architecture, manufacturing, administration, and many others. To design professional looking Flowchart Diagrams we recommend to use the ConceptDraw DIAGRAM diagramming and vector drawing software extended with set of Flowchart maker solutions from the Diagrams, Finance and Accounting, Marketing, and Business Processes areas of ConceptDraw Solution Park. ConceptDraw DIAGRAM flowchart software is rich for the libraries of ready-to-use predesigned vector flowchart objects, templates, samples and examples, which make it the best choice for designing the Flowcharts of any type and style. Besides, the ConceptDraw documents with Flowchart Diagrams are vector graphic documents, available for reviewing, modifying and converting to different popular formats: image, HTML, PDF file, MS PowerPoint Presentation, Adobe Flash or MS Visio XML.Home Architect Software. Home Plan Examples
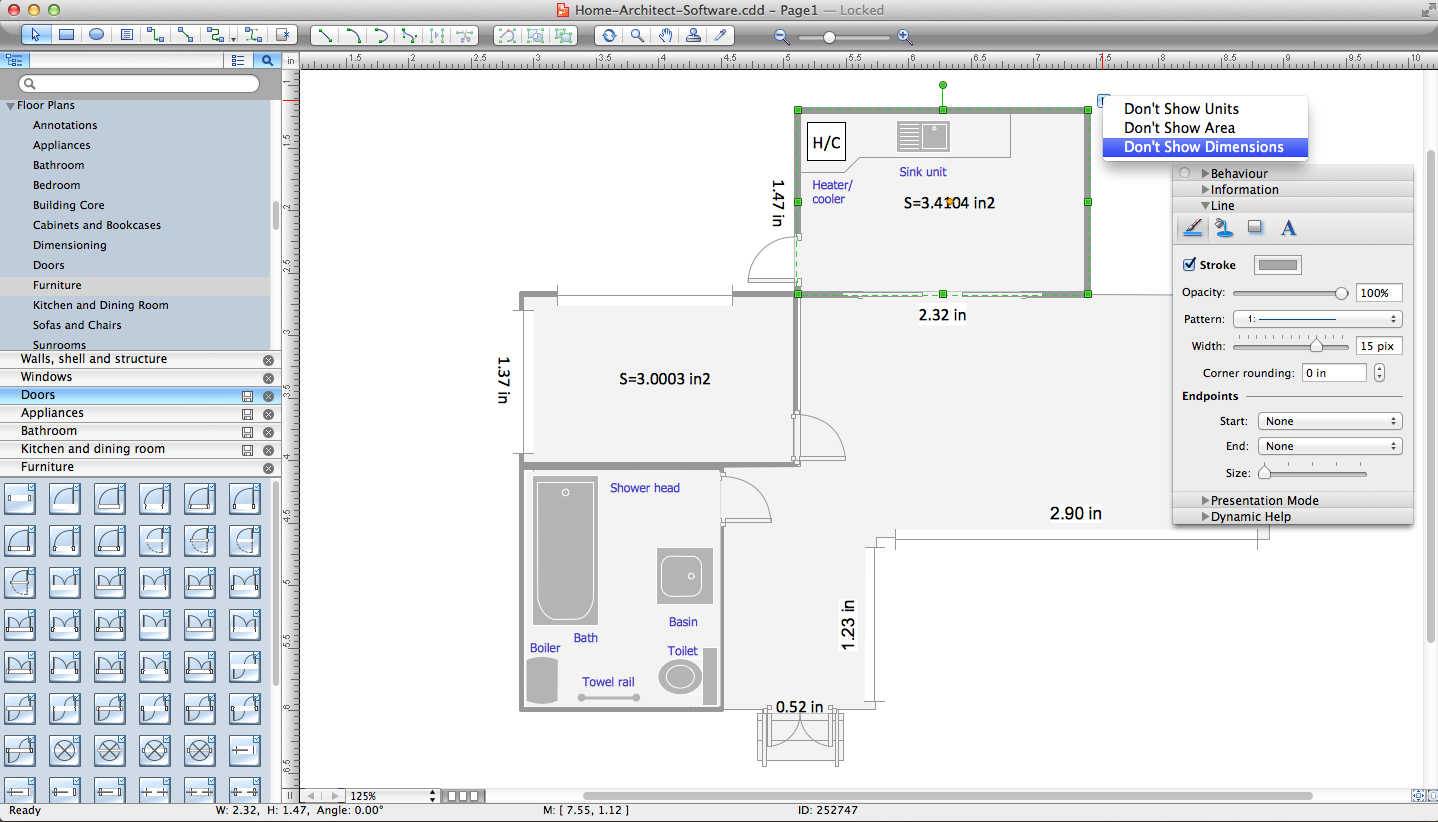
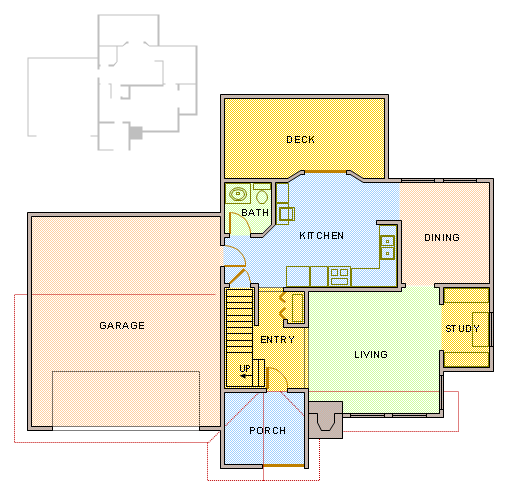
Everyone who starts the construction, repair or remodeling of the home, flat or office, is facing with a need of visualization its ideas for visual explanation how all should to be for the foreman and construction team. It is incredibly convenient to use for this professional home architect software. ConceptDraw DIAGRAM software enhanced with Floor Plans solution provides a lot of built-in drawing tools which allow you quick and easy create design plans for the home of your dreams.Pyramid Chart Examples
Pyramid Charts and Triangle Diagrams are used to visually structure the topics and progressively order the quantitative data. They allow to illustrate hierarchical structure of the topics, proportional, interconnected and containment relations among the topics. The multilevel Pyramids and Triangle diagrams are constructed oriented up or down and divided into several horizontal slices. They are effectively used to represent marketing strategies, social strategies, information systems, market value, etc., to illustrate presentations, websites, documents, reports in business, finances, sales, management, marketing, media, training, consulting, and many other fields. To maximize the efficiency in drawing the Pyramid Charts, use the ConceptDraw DIAGRAM diagramming and vector drawing software extended with Pyramid Diagrams solution from Marketing area, which contains the set of Pyramid Chart examples, samples, templates and vector design elements of triangular diagrams and pyramids with different quantity of levels for various needs.Office Layout
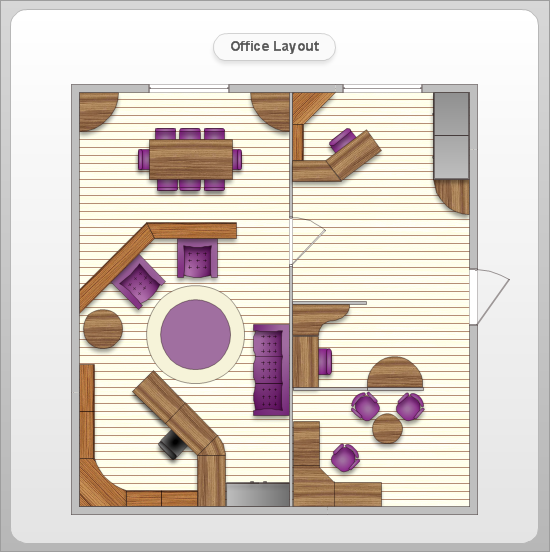
Each office is a unique space, thats why design of office premises has a lot of specifics based on the type of premise and kind of activity of the company which will be placed at this office. Different office concepts and features of office designs are also taken into consideration by designers and architects when office layout plans and designs are created, for construction new office buildings or renovation those built earlier. ConceptDraw DIAGRAM extended with Office Layout Plans solution from Building Plans area is a powerful diagramming and vector drawing software for designing Office Floor Plans, Office Layout Plans, Small Office Design Plans, Office Cabinet Plans, Commercial Floor plans, Home Office Plans, Plans for premises at large office centers, Electrical plans for offices, etc. Office Layout Plans solution includes 3 time-saving libraries of ready-to-use vector objects of office furniture and equipment which are incredibly helpful for design and implementation any of your office layout ideas.
Data Flow Diagram Software
Data Flow Diagrams (DFDs) are successfully used when studying the business processes or systems that involve the transfer of data. They are a visual way to represent the data processing, to model and visualize the flow of data through a computer system and functional requirements for a designed system. They are the good business modeling tool to describe the business events and interactions, the physical systems involving the storage and transfer of data. ConceptDraw DIAGRAM supplied with Data Flow Diagrams solution from Software Development area of ConceptDraw Solution Park is a modern and powerful data flow diagram software. This solution offers large set of predesigned DFD vector objects, grouped to three libraries: Data Flow Diagrams, Gane-Sarson Notation, and Yourdon and Coad Notation. All they and also collection of DFD samples and built-in templates make a good base for ConceptDraw DIAGRAM users, providing them all conditions for easy creation the Data Flow Diagrams and Data Flow Models of any complexity.How To Use Enterprise Collaboration Software
Enterprise collaboration software helps to facilitate action-oriented teams working together over geographic distances by providing tools that aids on communication, collaboration process and problem solving.
JSD - Jackson system development
Jackson System Development (JSD) is a linear method of system development created by Michael A. Jackson and John Cameron in the 1980s. It comprises the whole software life cycle directly or providing a framework for more specialized techniques. When implementing the Jackson System Development method and designing JSD diagrams, you can succesfully use the powerful and helpful tools of ConceptDraw DIAGRAM software extended with Entity-Relationship Diagram (ERD) solution from the Software Development area of ConceptDraw Solution Park.Personal area (PAN) networks. Computer and Network Examples
Personal area network (PAN) is a network organized on a limited area and used for data transmission between various personal devices, such as computers, tablets, laptops, telephones, different digital and mobile devices, etc. and also for connecting to higher level network and Internet. PAN is used to manage the interconnections of IT devices which surround a single user and generally contains such appliances, as cordless mice, keyboard, phone, and Bluetooth handsets. PANs can be wired with computer buses, or wirelessly connected to the Internet using such network technologies as Bluetooth, Z-Wave, ZigBee, IrDa, UWB, Body Area Network. PANs have a lot of pros and cons, they are expedient, lucrative and handy, but sometimes have bad connection with other networks on the same radio bands, Bluetooth has distance limits and slow data transfer speed, but is comparatively safe. ConceptDraw DIAGRAM diagramming software supplied with numerous solutions of Computer and Networks Area included to ConceptDraw Solution Park perfectly suits for designing the Personal Area Networks.
Software Flow Chart
Many professionals have to solve problems every day. Designing of the process algorithm contribute to understand where the problem is in the process. A Flowchart is a graphical tool that most usable for breaking down processes. Definition of flowchart - a diagram that shows step-by-step progression through a procedure or system especially using connecting lines and a set of conventional symbols. All the icons, symbols and connectors needed for creating standardized notation flowcharts are contained within Software Flow Chart.Entity Relationship Diagram Software
The world-best Entity Relationship Diagram software suitable for professional ERD drawing is ConceptDraw DIAGRAM software extended with the Entity-Relationship Diagram (ERD) solution. This solution contains all libraries, templates and samples you may need for professional ERD drawing.TQM Diagram Example
The Total Quality Management Diagram solution helps you and your organization visualize business and industrial processes. Create Total Quality Management diagrams for business process with ConceptDraw software.Mac OS GUI Software
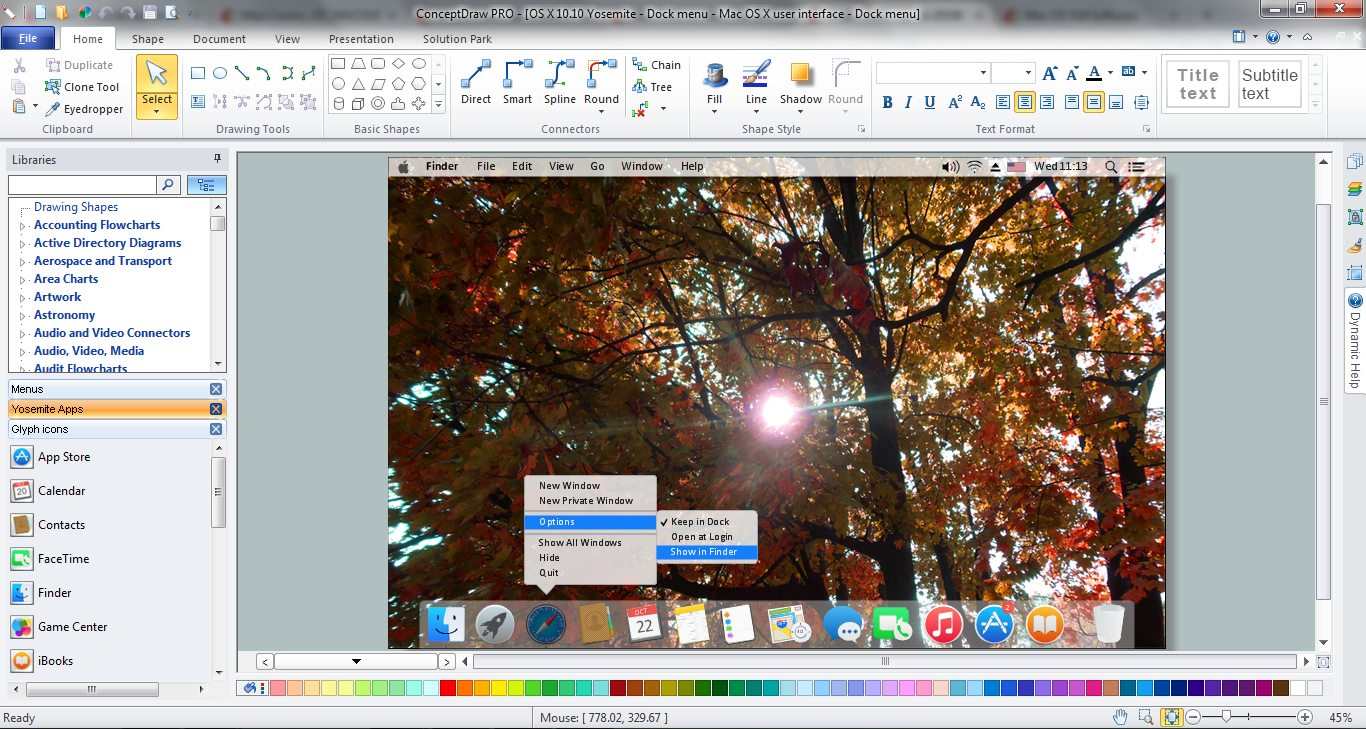
ConceptDraw DIAGRAM diagramming and vector drawing software extended with Mac OS User Interface Solution from the Software Development area is a powerful Mac OS GUI SoftwareOrganizational Structure Total Quality Management
The Total Quality Management Diagram solution helps you and your organization visualize business and industrial processes. Create Total Quality Management diagrams for business process with ConceptDraw software.Cloud Computing Architecture Diagrams
For documenting the Cloud Computing Architecture with a goal to facilitate the communication between stakeholders are successfully used the Cloud Computing Architecture diagrams. It is convenient and easy to draw various Cloud Computing Architecture diagrams in ConceptDraw DIAGRAM software with help of tools of the Cloud Computing Diagrams Solution from the Computer and Networks Area of ConceptDraw Solution Park.Cause and Effect Diagram Software
The Cause and Effect diagram introduced by Kaoru Ishikawa in 1968 is a method for analyzing process dispersion. It can help you to dive into a problem and find an effective solution, identify and represent the possible causes for an effect, analyze the complex business problems and successfully solve them. You can design your Cause and Effect diagram on a paper, but more effective way is to use specific software - ConceptDraw DIAGRAM is a powerful Cause and Effect Diagram Software. It helps you create Cause and Effect diagram known also as Fishbone diagram or Ishikawa diagram from templates and examples.How To use Architect Software
Professional building design and architect software are very popular among the modern designers, architects, and builders. They help visualize the building ideas, building concepts, effectively develop detailed building and architect design projects. ConceptDraw DIAGRAM diagramming and vector drawing software supplied with extensive Building Plans area is a powerful architect software. It allows professionally design and construct your home, office, school, shop, deck or landscape in a few minutes. It is a fastest way to create the Building plans, Floor plans, Home Floor plans, Electrical diagrams, Landscapes, Facility plans, Store layouts, and many other plans, drawings, and designs. You can use a lot of built-in templates, samples and examples offered by the building solutions of ConceptDraw Solution Park, we recommend to start with the exact template you need, then customize it with large variety of predesigned vector stencils to fit your needs, this lets to find an expected result quickly and without efforts.
- Software development with ConceptDraw Products | With The Aid Of ...
- Local area network (LAN). Computer and Network Examples | Cloud ...
- With Aid Of Diagram Explain Software
- With The Aid Of Diagram Explain Software Component
- Diagramming Software for Design UML Collaboration Diagrams ...
- Diagram Of Aid To Trade
- Diagramming Software for Design UML Collaboration Diagrams ...
- With The Aid Of Diagram Explain Trade
- Local area network (LAN). Computer and Network Examples ...
- Local area network (LAN). Computer and Network Examples ...
- Software Design Tools And Diagramming Aids
- Explane Software And Example With Diagrame
- How to Present Workflow to Team | UML Diagram for Mac | Electrical ...
- Software Diagram Examples and Templates | Entity Relationship ...
- Network Diagram Software . LAN Network Diagrams. Physical Office ...
- Local area network (LAN). Computer and Network Examples ...
- With The Aid Of Diagram Illustrate Trade And Aid To Trade
- Network Diagram Examples | Wide area network (WAN) topology ...
- Software Development Area | Bubble diagrams in Landscape ...
- With The Aid Of Diagram Explain The Purchasing Cycle


