Pie Chart Word Template. Pie Chart Examples

HelpDesk
How to Draw a Pie Chart

Pie Chart Software

Examples of Flowcharts, Org Charts and More


Pyramid Chart Examples

Flow Chart Symbols

Flow Chart Symbols

Pie Donut Chart. Pie Chart Examples

 Pie Charts
Pie Charts are extensively used in statistics and business for explaining data and work results, in mass media for comparison (i.e. to visualize the percentage for the parts of one total), and in many other fields. The Pie Charts solution for ConceptDraw DIAGRAM offers powerful drawing tools, varied templates, samples, and a library of vector stencils for simple construction and design of Pie Charts, Donut Chart, and Pie Graph Worksheets.
Organizational Chart Template

The Best Drawing Program for Mac

Donut Chart Templates

Pie Chart

Business Report Pie. Pie Chart Examples

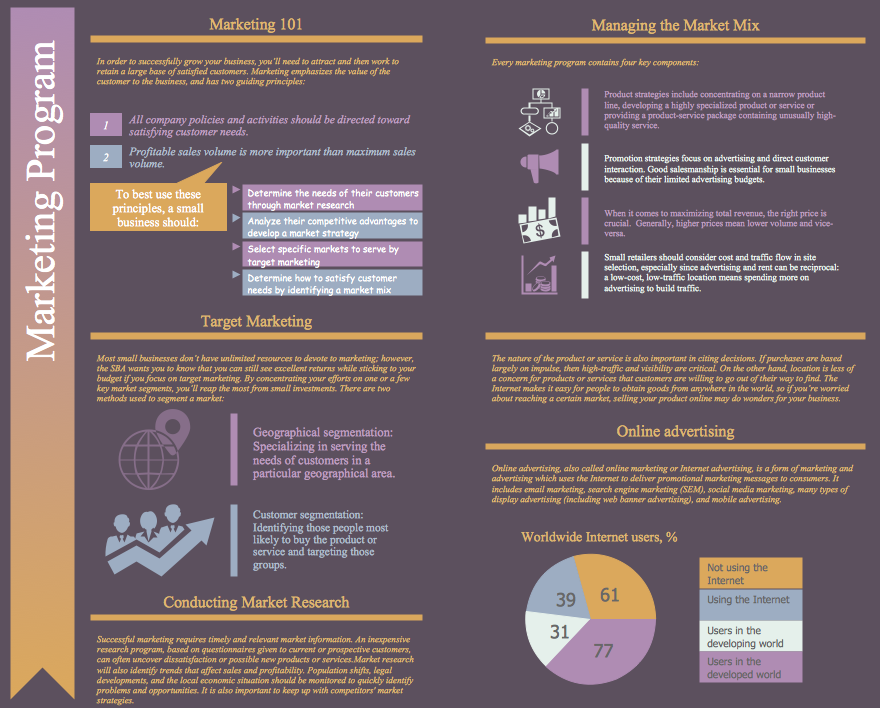
Marketing Plan Infographic
- Pie chart - Template | Design elements - Composition charts and ...
- Examples of Flowcharts, Org Charts and More | Pie Chart Examples ...
- Business Report Pie. Pie Chart Examples | Bar Chart Examples ...
- How to Draw an Organization Chart | How to Draw a Pie Chart Using ...
- Example Of Pie Chart For The Cost Of The Project
- Human Resource Development | Pie Chart Examples and ...
- Arrow circle chart - Template | Pie Charts | Pie Chart Examples and ...
- Pie Charts | Pie Chart Examples and Templates | How to Create a ...
- Schedule pie chart - Daily action plan | ConceptDraw PROJECT ...
- Business Report Pie. Pie Chart Examples | Design elements - Sales ...
- Seven Management and Planning Tools | Design elements ...
- Schedule pie chart - Daily action plan | Gant Chart in Project ...
- Chart Templates | Pie Charts | Chart Examples | Energy And Its ...
- Frequency Distribution Dashboard | Design elements - Frequency ...
- PM Personal Time Management | Schedule pie chart - Daily action ...
- Pie Charts | HVAC Plans | Fishbone Diagram | How To Make Project ...
- Business Report Pie. Pie Chart Examples | One formula of ...
- Business Report Pie. Pie Chart Examples | Communication Tool for ...
- Chart Examples | Pyramid Diagram | Pie Charts | Energy And Its ...
- Pie Chart Examples and Templates | Process Flowchart | Basic ...