Line Chart Template for Word
This sample was created in ConceptDraw DIAGRAM diagramming and vector drawing software using the Line Graphs Solution from Graphs and Charts area of ConceptDraw Solution Park. This sample shows the Line Chart of annual percentage change. The Line Chart allows you to clearly see the changes of data over the time.Business People Clipart
Business People Clipart - Business and Finance solution from Illustration area of ConceptDraw Solution Park. Use it to quick draw illustrations, diagrams and infographics for your business documents, presentations and websites. The vector stencils library Business People Clipart includes 12 images.Marketing and Sales Organization chart. Organization chart Example
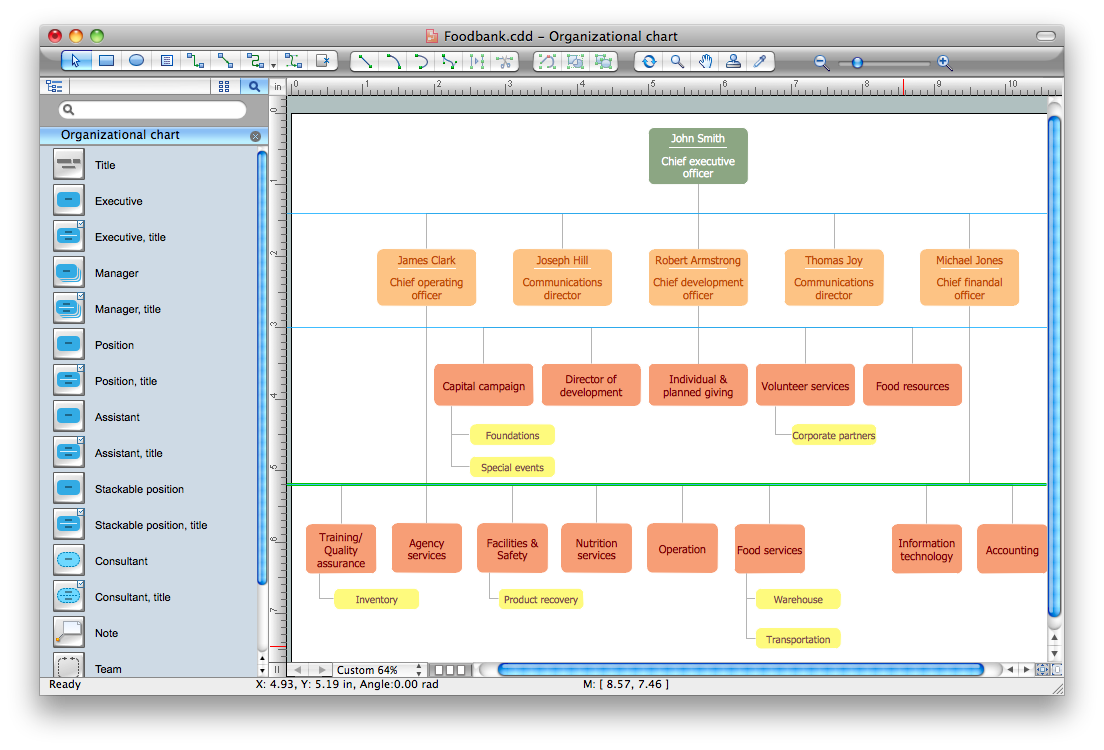
The use of Organization Charts is very popular at the fields of marketing and sales. They help to depict in a visual form a lot of information about organization: the company's structure, relationships of positions within an organization in terms of authorities and responsibilities, and company's strategies. All Organizational Charts are constructed from the similar building blocks (rectangles and lines), this makes them easily for interpretation and understanding by all interested people inside and outside of this company, such as shareholders, employees, investors, distributors, suppliers, customers, etc. Organization Charts can be hand-drawn on the paper, however the preferable is to use a special software. ConceptDraw DIAGRAM diagramming and vector graphics software extended with useful Organizational Charts solution is ideal for easy representing information and data, and professional drawing Marketing and Sales Organization Chart with any depth of detailing. Organizational structure may differ during the company's development, you can design and compare the charts on each stage.
 Organizational Charts
Organizational Charts solution extends ConceptDraw DIAGRAM software with samples, templates and library of vector stencils for drawing the org charts.
Matrix Organization Structure
Matrix organizational structure is one of the main forms of structures which is actively used by organizations to carry forth the functions of a company visually and effectively. Now we have ConceptDraw DIAGRAM diagramming and vector drawing software extended with 25 Typical Orgcharts solution from the Management area of ConceptDraw Solution Park which will help easy represent matrix organizational structure of any degree of complexity.Remote Projects in Corporate Strategy
Communication is the main challenge and the key success factor for organizational project management in company with remote projects. Communicating visually via Skype you bring all projects together to achieve corporate goals.
Organogram Software
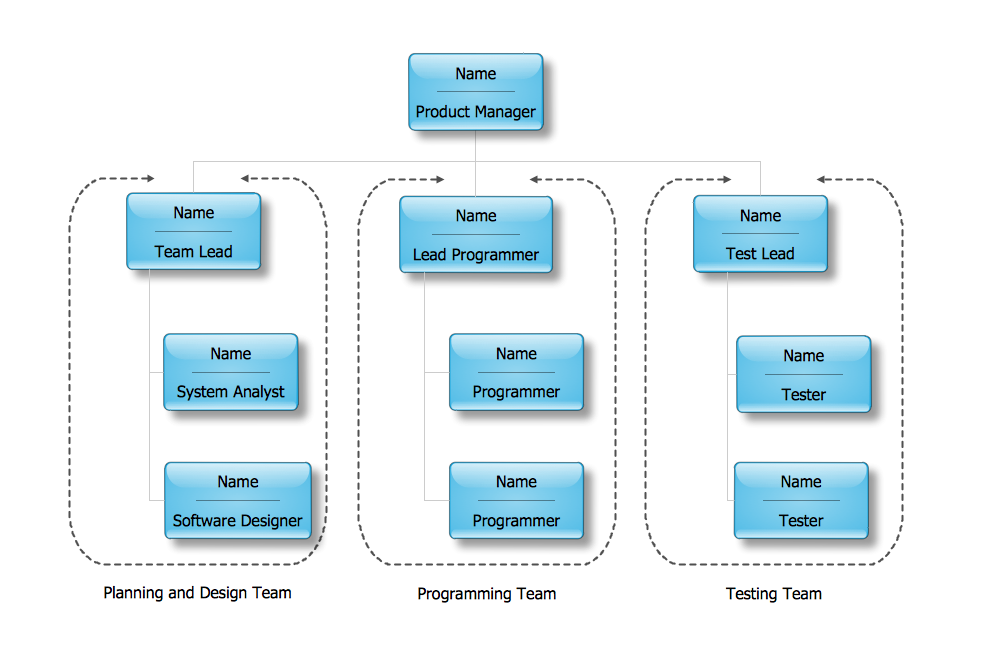
Organizing process is the process of creating the organizational structure of an enterprise. The organizing process consists of several stages. First, you need to divide the organization into departments, respectively to strategies, and then establish relationships of authority. After that, managing director delegates his rights and authorities.Venn Diagram Template for Word
This template shows the Venn Diagram. It was created in ConceptDraw DIAGRAM diagramming and vector drawing software using the ready-to-use objects from the Venn Diagrams Solution from the "Diagrams" area of ConceptDraw Solution Park.Organization Chart Templates
Organization Chart Templates - Organizational Charts Solution from the Management Area of ConceptDraw Solution Park provides a wide collection of predesigned templates and samples that will help you create the Organizational Charts of any complexity in one moment.Organizational Chart Template
Organizational Charts help to show the relationships of positions within an organization in terms of authority and responsibility. They typically give an actual and clear “snapshot” picture of an organization for both employees and individuals outside, they visually show divisions of work, levels of management, and reporting relationships. ConceptDraw DIAGRAM graphical software supplied with Organizational Charts Solution from the Management Area of ConceptDraw Solution Park offers a number of ready-made organizational chart samples, examples and templates, which you can use as a foundation in your drawing. All they are grouped in topical sets as organizational chart template files and allow easily depict a wide array of organizational structure types, and to represent any business organizational structure, matrix organization structure, or functional structure. Inside the Organizational Charts solution you will find also a set of vector shape libraries containing a lot of icons needed for effective illustration the Organizational Structure Charts of any complexity.
 Line Graphs
How to draw a Line Graph with ease? The Line Graphs solution extends the capabilities of ConceptDraw DIAGRAM with professionally designed templates, samples, and a library of vector stencils for drawing perfect Line Graphs.
 Accounting Flowcharts
Accounting Flowcharts solution extends ConceptDraw DIAGRAM software with templates, samples and library of vector stencils for drawing the accounting flow charts.
Financial Comparison Chart
This sample shows the Bar Chart of the leverage ratios for two major investment banks. The leverage ratio is the ratio of the total debt to the total equity; it is a measure of the risk taken by the bank. The higher of the leverage ratio denotes the more risk, the greater risks can lead to the subprime crisis.Organizational Chart Templates
ConceptDraw offers you a number of ready-made organizational chart templates which you can use in your drawing. They are grouped in topical sets as organizational chart template files. Use the Organizational Charts Solution for ConceptDraw DIAGRAM to create your own Organizational Charts of any complexity quick, easy and effective. The Organizational Charts designed with ConceptDraw DIAGRAM are vector graphic documents and are available for reviewing, modifying, converting to a variety of formats (image, HTML, PDF file, MS PowerPoint Presentation, Adobe Flash or MS Visio XML), printing and send via e-mail in one moment.
Chart Templates
Easy charting software comes with beautiful chart templates and examples. This makes it easy to create professional charts without prior experience.
 25 Typical Orgcharts
The 25 Typical Orgcharts solution contains powerful organizational structure and organizational management drawing tools, a variety of professionally designed organization chart and matrix organization structure samples, 25 templates based on various orga
Cross-Functional Process Map Template
When you need a drawing software to create a professional looking cross-functional charts, ConceptDraw with its Arrows10 Technology - is more than enough versatility to draw any type of diagram with any degree of complexity. Use templates with process maps, diagrams, charts to get the drawing in minutes.Organizational Structure Diagram Software
ConceptDraw DIAGRAM extended with Organizational Charts Solution from the Management Area is a powerful but easy-to-use Organizational Structure Diagram Software. Organizational Charts Solution provides a wide variety of templates and samples and large quantity of predesigned vector objects to help you design your Organizational Structure Diagrams and other business diagrams.
Scatter Chart Analysis. Scatter Chart Example
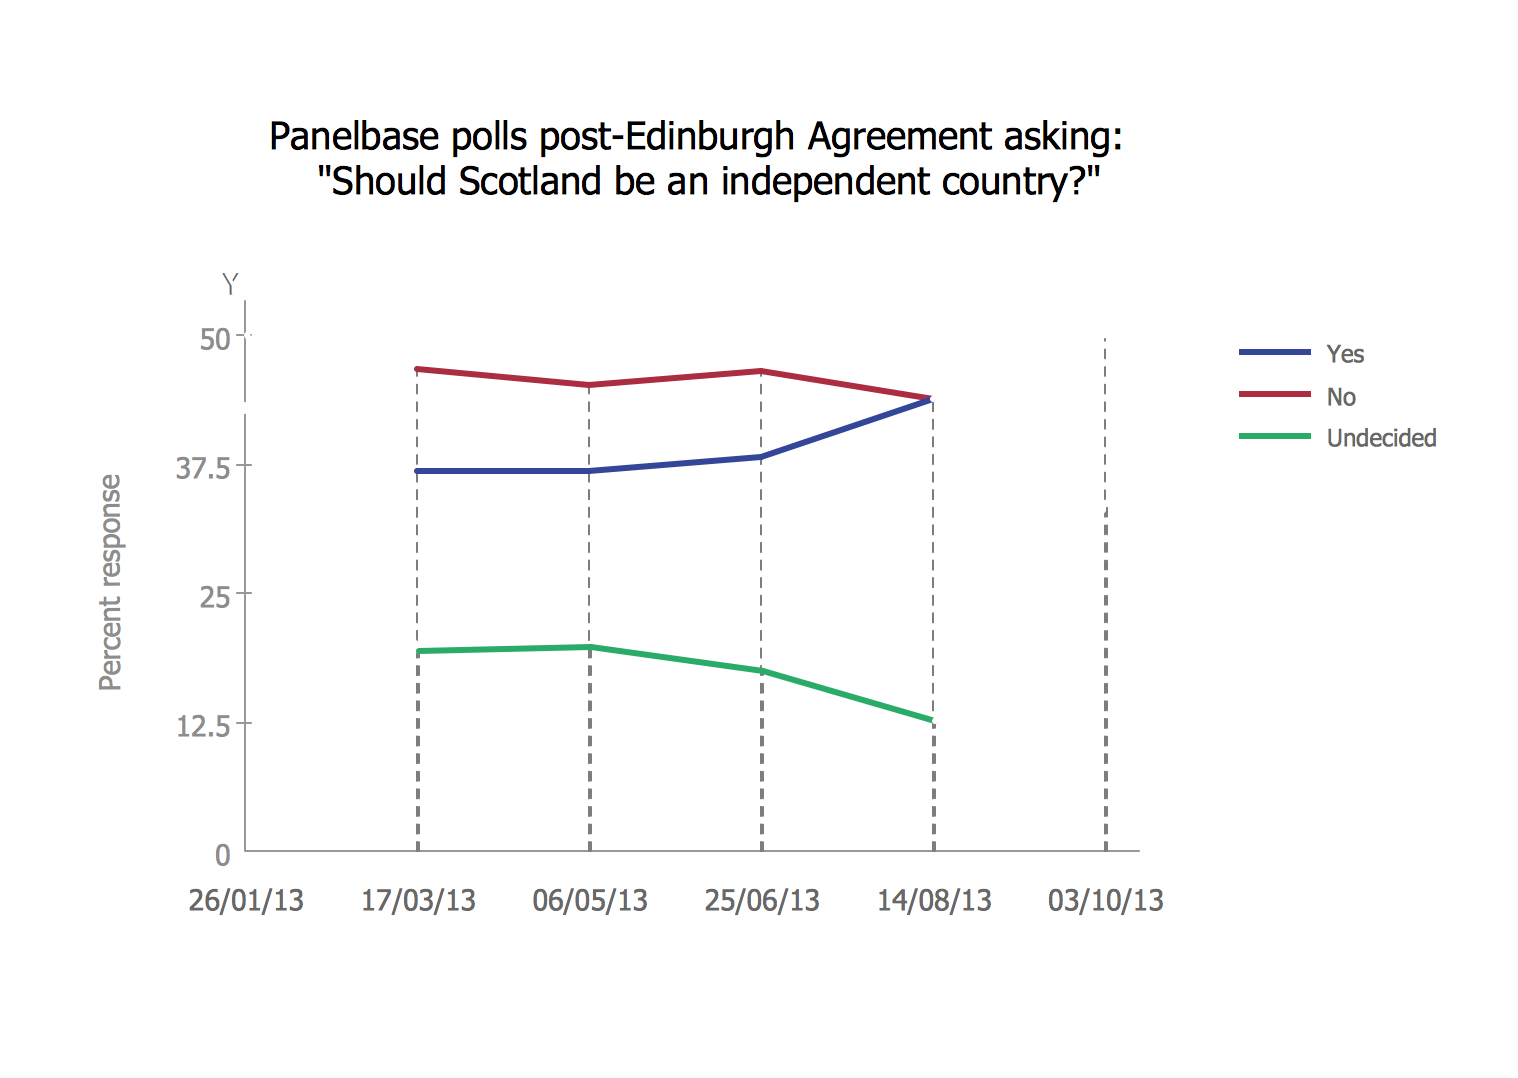
This sample shows the Scatter Chart that displays the polls on the referendum 2014 in Scotland. On this Scatter Chart the data are represented as points with two values of variables in the Cartesian coordinates. The points are connected by lines. This diagram can be useful in different opinion polls, referendums, for creating the reports.How to Draw an Organization Chart
An Organizational chart is a type of diagram which visually displays the structure of an organization, relationships and relative ranks of the organization′s parts and positions. Organizational chart is constructed as an hierarchical structure, in the form of tree. How to Draw an Organization Chart the most easy and quickly? The Organizational Charts solution, innovative Tree Auto-connection mode and ConceptDraw Arrows10 Technology included in ConceptDraw DIAGRAM software are powerful drawing tools that change the way of diagrams production. Arrows10 Technology provides smart behavior for the connectors, and so quick and precise placement when drawing, and lets easy make the changes and automatic rearrangement. It helps to make the process of drawing diagrams more efficient, easier and faster. Now, you don′t need to think on how to connect or place the objects, you can concentrate fully on what to draw. See obligatory the helpful video tutorial about creation the Organization Charts and orgchart professional presentations with ConceptDraw products.- Sample Of Finance Department Organization Chart
- Organizational Chart Excel Two Reporting Lines
- Example Finance Department Workflow
- Basic Flowchart Symbols and Meaning | Organizational Charts with ...
- Examples of Flowcharts, Org Charts and More | Create ...
- Audit Process Flowchart. Audit Flowchart | Matrix Organization ...
- How Do You Make An Accounting Process Flowchart? | Process ...
- How to Draw an Organization Chart | Create Organizational Chart ...
- Accounting Department Structure Chart For Purchasing Company
- How to Draw an Organization Chart | Marketing Organization Chart ...
- Business Report Pie. Pie Chart Examples | Examples of Flowcharts ...
- Draw Company Structure with Organization Charting Software ...
- Flow Chart Finance Department
- Business Report Pie. Pie Chart Examples | Visual Reports | Website ...
- Business Report Pie. Pie Chart Examples
- How to Draw an Organization Chart | Organizational Charts ...
- Financial Comparison Chart | Business Report Pie. Pie Chart ...
- How to Draw a Flat Organizational Chart with ConceptDraw PRO ...
- Sales Growth. Bar Graphs Example | Business Report Pie. Pie Chart ...
- Accounting Flowchart: Purchasing, Receiving, Payable and ...


