This site uses cookies. By continuing to browse the ConceptDraw site you are agreeing to our Use of Site Cookies.

How Do Fishbone Diagrams Solve Manufacturing Problems

How do Fishbone diagrams solve manufacturing problems? Fishbone diagrams are successfully used in various fields of industries and manufacturing to analyze the set of possible causes and their effects. Fishbone diagram provides a process to clearly define the “Effect” and then puts you to thinking about the possible causes, based on the categories of common problems in manufacturing. ConceptDraw DIAGRAM application extended with Fishbone Diagrams solution lets you construct Fishbone diagrams and represent globally recognized standards for manufacturing 6 Ms and 8 Ms.

Value-Stream Mapping for Manufacturing

Create value stream maps - for value stream analysis and value stream management, material and information flow mapping, using our quick start templates included with ConceptDraw.

Bar Diagrams for Problem Solving. Create manufacturing and economics bar charts with Bar Graphs Solution

Create bar charts for visualizing problem solving in manufacturing and economics using the ConceptDraw DIAGRAM diagramming and vector drawing software extended with the Bar Graphs Solution from the Graphs and Charts area of ConceptDraw Solition Park.

manufacturing drawings Manufacturing and Maintenance

manufacturing drawings
Manufacturing and maintenance solution extends ConceptDraw DIAGRAM software with illustration samples, templates and vector stencils libraries with clip art of packaging systems, industrial vehicles, tools, resources and energy.

Data Flow Diagram Model

Data Flow Diagram (DFD) is a technique of graphical structural analysis, describing the sources external to the system, recipients of data, also logical functions, data flows and data stores that are accessed. The DFD's goal is to show how each process converts its inputs into the outputs and to identify relationships between these processes, at this make the system's description clear and understandable at every level of detail. Historically happened that for describing Data Flow Diagrams are used two notations - Yourdon and Gane-Sarson that differ each from other by graphical representation of symbols. The DFD model, like most other structural models is a hierarchical model. Each process can be subjected to decomposition on the structural components, the relationships between which in the same notation can be shown on a separate diagram. Typically, several DFD models are built when modeling the system. ConceptDraw DIAGRAM software enhanced with Data Flow Diagrams solution ideally suits for creation DFD models and professional drawing Data Flow Diagrams.
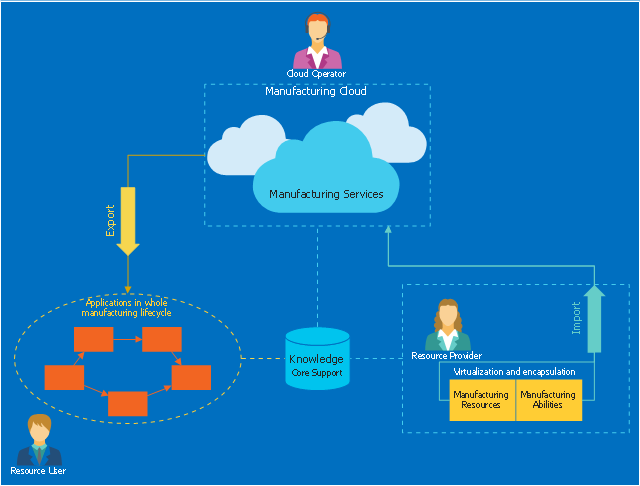
This cloud computing diagram example was drawn on the base of Wikimedia Commons file: Principal cloud manufacturing.png. [commons.wikimedia.org/ wiki/ File:Principal_ cloud_ manufacturing.png]
This file is licensed under the Creative Commons Attribution-Share Alike 3.0 Unported license. [creativecommons.org/ licenses/ by-sa/ 3.0/ deed.en]
"Cloud manufacturing (CMfg) is a new manufacturing paradigm developed from existing advanced manufacturing models (e.g., ASP, AM, NM, MGrid) and enterprise information technologies under the support of cloud computing, Internet of Things (IoT), virtualization and service-oriented technologies, and advanced computing technologies. It transforms manufacturing resources and manufacturing capabilities into manufacturing services, which can be managed and operated in an intelligent and unified way to enable the full sharing and circulating of manufacturing resources and manufacturing capabilities. CMfg can provide safe and reliable, high quality, cheap and on-demand manufacturing services for the whole lifecycle of manufacturing." [Cloud manufacturing. Wikipedia]
The cloud computing diagram example "Principal cloud manufacturing" was drawn using ConceptDraw PRO software extended with the Cloud Computing Diagrams solution from the Computer and Networks area of ConceptDraw Solution Park.
Cloud computing diagram example
Cloud computing diagram example, user woman, user man, rectangle, frame, rectangle, blue, operator, network bus, ellipse, frame, elbow connector, one-way, direct connector, one-way, database, magnetic disk, cloud, arrow one-way, Direct connector dotted, without arrows,

Data Flow Diagram Examples

Data flow diagrams (DFDs) are effective to reveal relationships among the various components in a program or system. This type of diagrams is an important and useful technique for modeling an information system, its process aspects, for showing a system as a single high-level process. DFD lets illustrate the flow of data, how the input data are transformed to output results across the sequence of functional transformations. DFD consists of four major components: entities, processes, data stores, data flows. When you need to draw a Data Flow Diagram the ConceptDraw DIAGRAM diagramming and vector drawing software extended with Data Flow Diagrams solution will be helpful for you. Providing numerous collection of Data Flow Diagram examples, samples, templates and ready-to-use vector DFD symbols, Data Flow Diagrams solution ensures you with all needed tools for easy designing DFDs according to Gane-Sarson or Yourdon-Coad notation on your choice. Any from offered predesigned DFD examples can become a perfect base for your own diagram.

Cross Functional Flowchart Examples

Take a look on an example of Cross-Functional-Flowchart, showing the software service cross-function process flowcharts among the different departments. It presents a simple flowchart among the customer, sales, technical support, tester and development. Try now Flowchart Software and Cross-Functional library with 2 libraries and 45 vector shapes of the Cross-Functional Flowcharts solution. Then you can use built-in templates to create and present your software service cross-function process flowcharts.

How to Build Cloud Computing Diagram Principal Cloud Manufacturing

The term “cloud” is very popular and widely used now, it is a server, data processing centre, or a network which lets to store the data and software, provides access to them, allows to run applications without installation and gives the possibility to process data hosted remotely via the Internet connection. For documenting the Cloud Computing Architecture with a goal to facilitate the communication between stakeholders are successfully used the Cloud Computing Architecture diagrams. It is convenient and easy to draw various Cloud Computing Architecture diagrams in ConceptDraw DIAGRAM software with help of tools of the Cloud Computing Diagrams Solution from the Computer and Networks Area of ConceptDraw Solution Park.

Flow chart Example. Warehouse Flowchart

Warehouse Flowcharts are various diagrams that describe the warehousing and inventory management processes on the warehouses. Typical purposes of Warehouse Flowcharts are evaluating warehouse performance, measuring efficiency of customer service and organizational performance. This type of Workflow diagrams can be used for identifying any disconnection between business activities and business objectives. They are effectively used by warehouse-related people and organizations, manufacturers, wholesalers, exporters, importers, transporters, and others. Standard Warehousing process flow diagram and standard Workflow diagram are used for process identification for further evaluating effectiveness and profitability of overall business process. Use the ConceptDraw DIAGRAM ector graphic software extended with Flowcharts solution to design your own professional-looking Workflow diagrams and Flowcharts of any types, including the Warehouse flowchart, Process flow diagrams which depict in details all steps of Warehouse packages flow. Microsoft Visio, designed for Windows users, can’t be opened directly on Mac. But fortunately, there are several Visio alternatives for Mac which will help Mac users to work Visio files. With ConceptDraw DIAGRAM , you may open, edit and save files in Visio format.
ConceptDraw Arrows10 Technology