 25 Typical Orgcharts
The 25 Typical Orgcharts solution contains powerful organizational structure and organizational management drawing tools, a variety of professionally designed organization chart and matrix organization structure samples, 25 templates based on various orga
 Organizational Charts
Organizational Charts solution extends ConceptDraw PRO software with samples, templates and library of vector stencils for drawing the org charts.
 SWOT and TOWS Matrix Diagrams
SWOT and TOWS Matrix Diagrams solution extends ConceptDraw PRO and ConceptDraw MINDMAP software with features, templates, samples and libraries of vector stencils for drawing SWOT and TOWS analysis matrices and mind maps.
Diagram Software - The Best Choice for Diagramming
For vector shapes and connector tools for quick and easy drawing diagrams for business, technology, science and education - The best choice for Diagramming is ConceptDraw PRO.HelpDesk
How to Create an Enterprise Architecture Diagram in ConceptDraw PRO
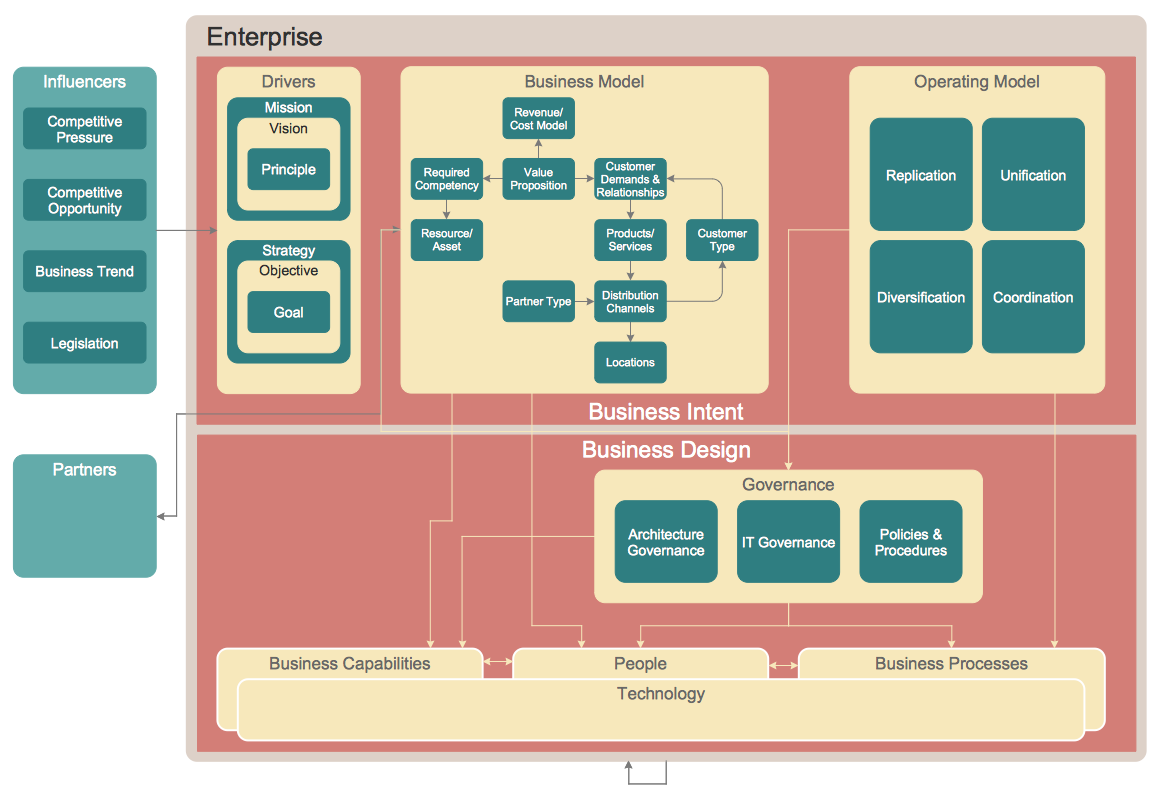
An Enterprise Architecture (EA) diagram is used to display the structure and operations of an organization.It is used to analyze and document an organization and its business functions, along with the applications and systems on which they are implemented. The aim of an enterprise architecture diagram is to determine how an organization can effectively achieve its current and future objectives. The Enterprise Architecture often uses diagrams to support the decision-making process. ConceptDraw PRO allows you to design Enterprise Architecture diagrams of any complexity.
 Event-driven Process Chain Diagrams
Event-driven Process Chain (EPC) Diagram is a type of flowchart widely used for modeling in business engineering and reengineering, business process improvement, and analysis. EPC method was developed within the Architecture of Integrated Information Systems (ARIS) framework.
 Computer Network Diagrams
Computer Network Diagrams solution extends ConceptDraw PRO software with samples, templates and libraries of vector icons and objects of computer network devices and network components to help you create professional-looking Computer Network Diagrams, to plan simple home networks and complex computer network configurations for large buildings, to represent their schemes in a comprehensible graphical view, to document computer networks configurations, to depict the interactions between network's components, the used protocols and topologies, to represent physical and logical network structures, to compare visually different topologies and to depict their combinations, to represent in details the network structure with help of schemes, to study and analyze the network configurations, to communicate effectively to engineers, stakeholders and end-users, to track network working and troubleshoot, if necessary.
 Entity-Relationship Diagram (ERD)
An Entity-Relationship Diagram (ERD) is a visual presentation of entities and relationships. That type of diagrams is often used in the semi-structured or unstructured data in databases and information systems. At first glance ERD is similar to a flowch
- Example Circular Organizational Chart
- Circular Diagram Example
- Circular Chart In Organisation
- Examples Of Company That Uses Circular Structure
- Examples of Flowcharts, Org Charts and More | Circular Diagram ...
- Examples Of Organisations With Circular Structure
- Example Of A Circular Organisational Structure
- Target Diagram | Examples of Flowcharts, Org Charts and More ...
- Structure Of Circular Organisation Chart
- Picture Of Circular Organisational Chart
- Example Of Circular Organisations Structure
- Examples of Flowcharts, Org Charts and More | Target and Circular ...
- Business Diagram Software | Examples of Flowcharts, Org Charts ...
- Examples Of Companies Using Circular Organisation Structure
- Circular Organization
- Examples Of Circular Organisation Structure
- Examples Of Circular Structure Organisation
- Organizational Structure Circular
- Example Of Concentric Or Circular Organization Chart
- Examples of Flowcharts, Org Charts and More | 25 Typical Orgcharts ...

