Physical Activity Plan
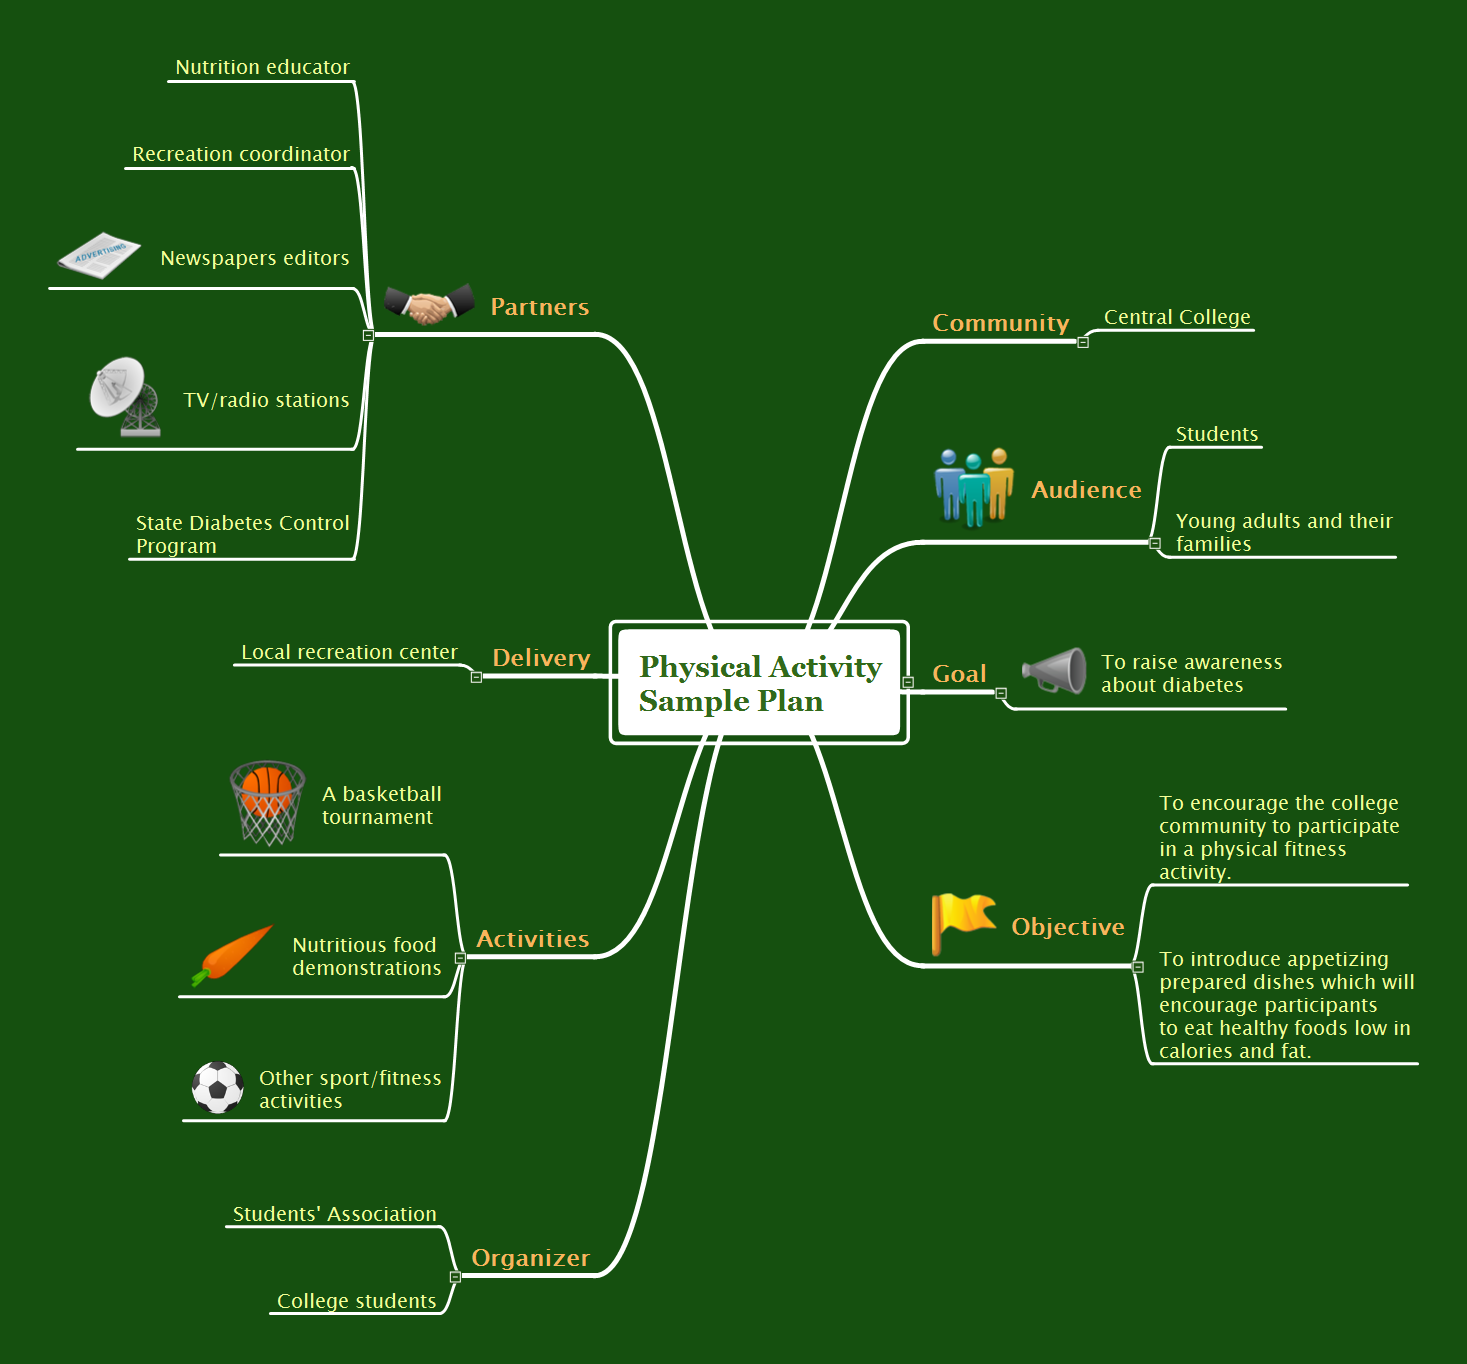
The physical activity is one of the key aspects of a healthy lifestyle. It makes a person not only more attractive physically, but also significantly improves his health, positively affects the life's duration, reduces the chances of appearance the serious diseases. This can be a serious sports occupation, but it is not necessary, the moderate physical activity is also very useful and important for everyone. It can be any muscle activity performed during the day, week, month, or year, no matter these are the special physical exercises, dancing, housework, working in the garden, climbing stairs, or just walking. The physical activity has a particular importance for children's health. The exercises and physical activity allow children to prevent development of various chronic diseases and heart illnesses yet at early age, promotes healthy and harmonious child's development, physical, mental and intellectual. The Mind Map designed in ConceptDraw MINDMAP software depicts detailed activity plan, which illustrates the proposal to incorporate more physical activity into a college community.
 MindTweet
This solution extends ConceptDraw MINDMAP software with the ability to brainstorm, review and organize the sending of Tweets.
Fishbone Diagram Template
A causal model is an abstract concept, that describes the causal mechanisms of a system, by noting certain variables and their influence on each other, in an effort to discover the cause of a certain problem or flaw. This model is presented in diagram form by using a fishbone diagram. ConceptDraw DIAGRAM diagramming and vector drawing software enhanced with Fishbone Diagrams solution helps you create business productivity diagrams from Fishbone diagram templates and examples, that provide to start using of the graphic method for the analysis of problem causes. Each predesigned Fishbone Diagram template is ready to use and useful for instantly drawing your own Fishbone Diagram.Sales Plan
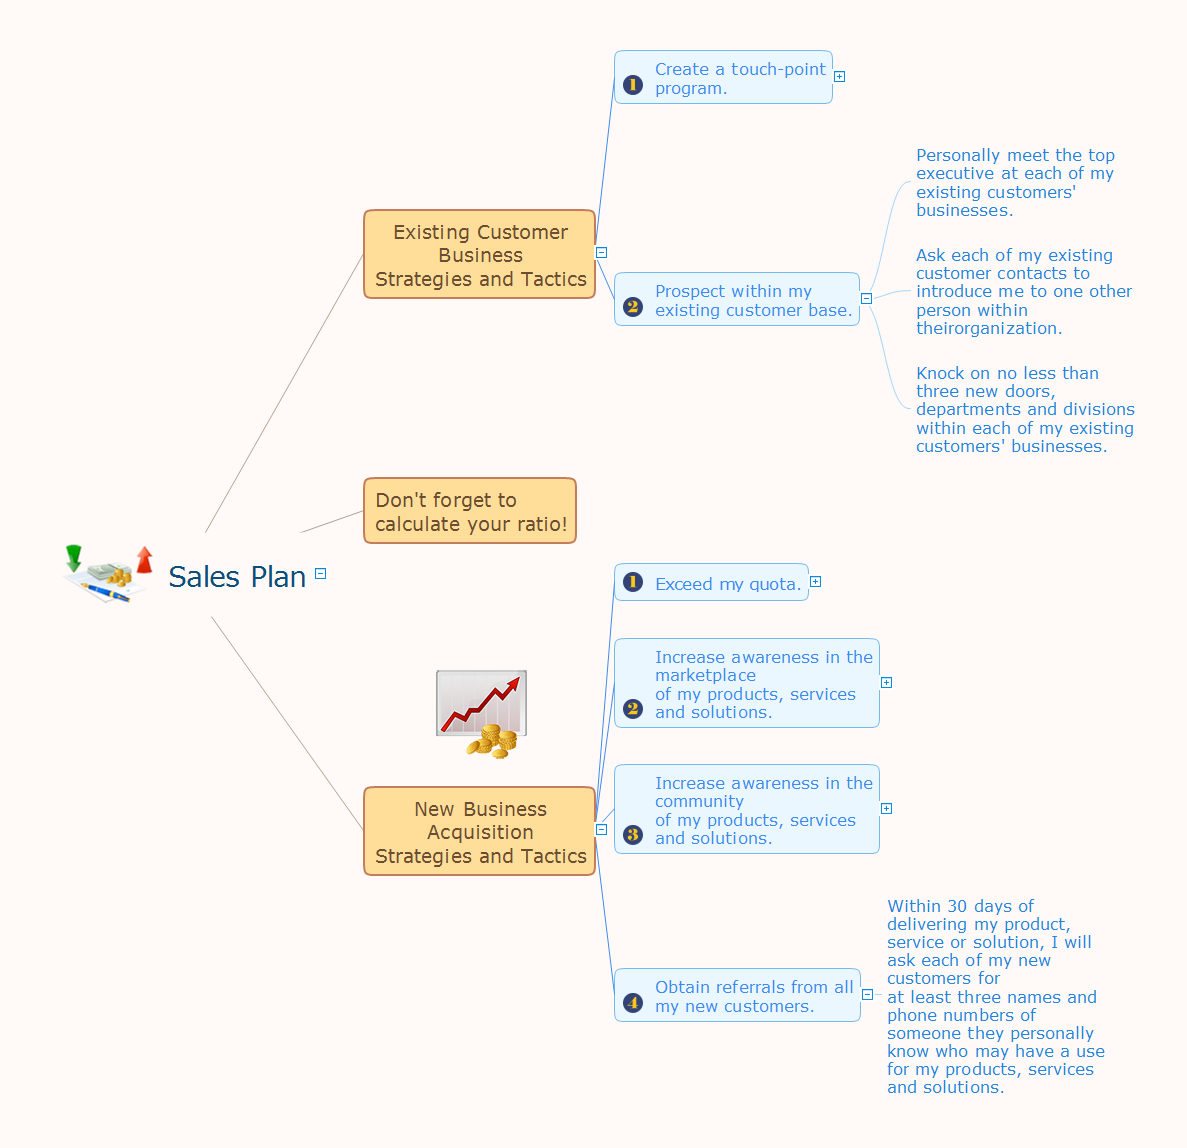
The welfare of the entire company depends on the work of sales department, since the volume of sales sets the level of incomes. The realistic and competently composed sales plan is a component of success, prosperity and stability of the company. The sales plan will help to define specific goal for development of organization for a specified period of time and to define the boundaries of possibilities. The business inevitably faces with various contingencies, but the task of sales department is to maximize the use of existing resources for successful realizing the sales plan. When constructing the sales plan, you should carefully analyze the macroeconomic and political trends, to study the situation on the market and forecasts for dynamics, to take in account the results of competitors, to carefully consider results of work of sales department for the last years and the pace of company's development, to analyze the causes of growth or decline of sales in certain periods. Set the realistic goals and make the sales plan easily in ConceptDraw MINDMAP , don't forget to include to the budget the expenses on sales, such as the costs for advertising, supplies, salaries and bonuses. Save your plan in the form of presentation for easy discussion with other employees of the company.UML Business Process
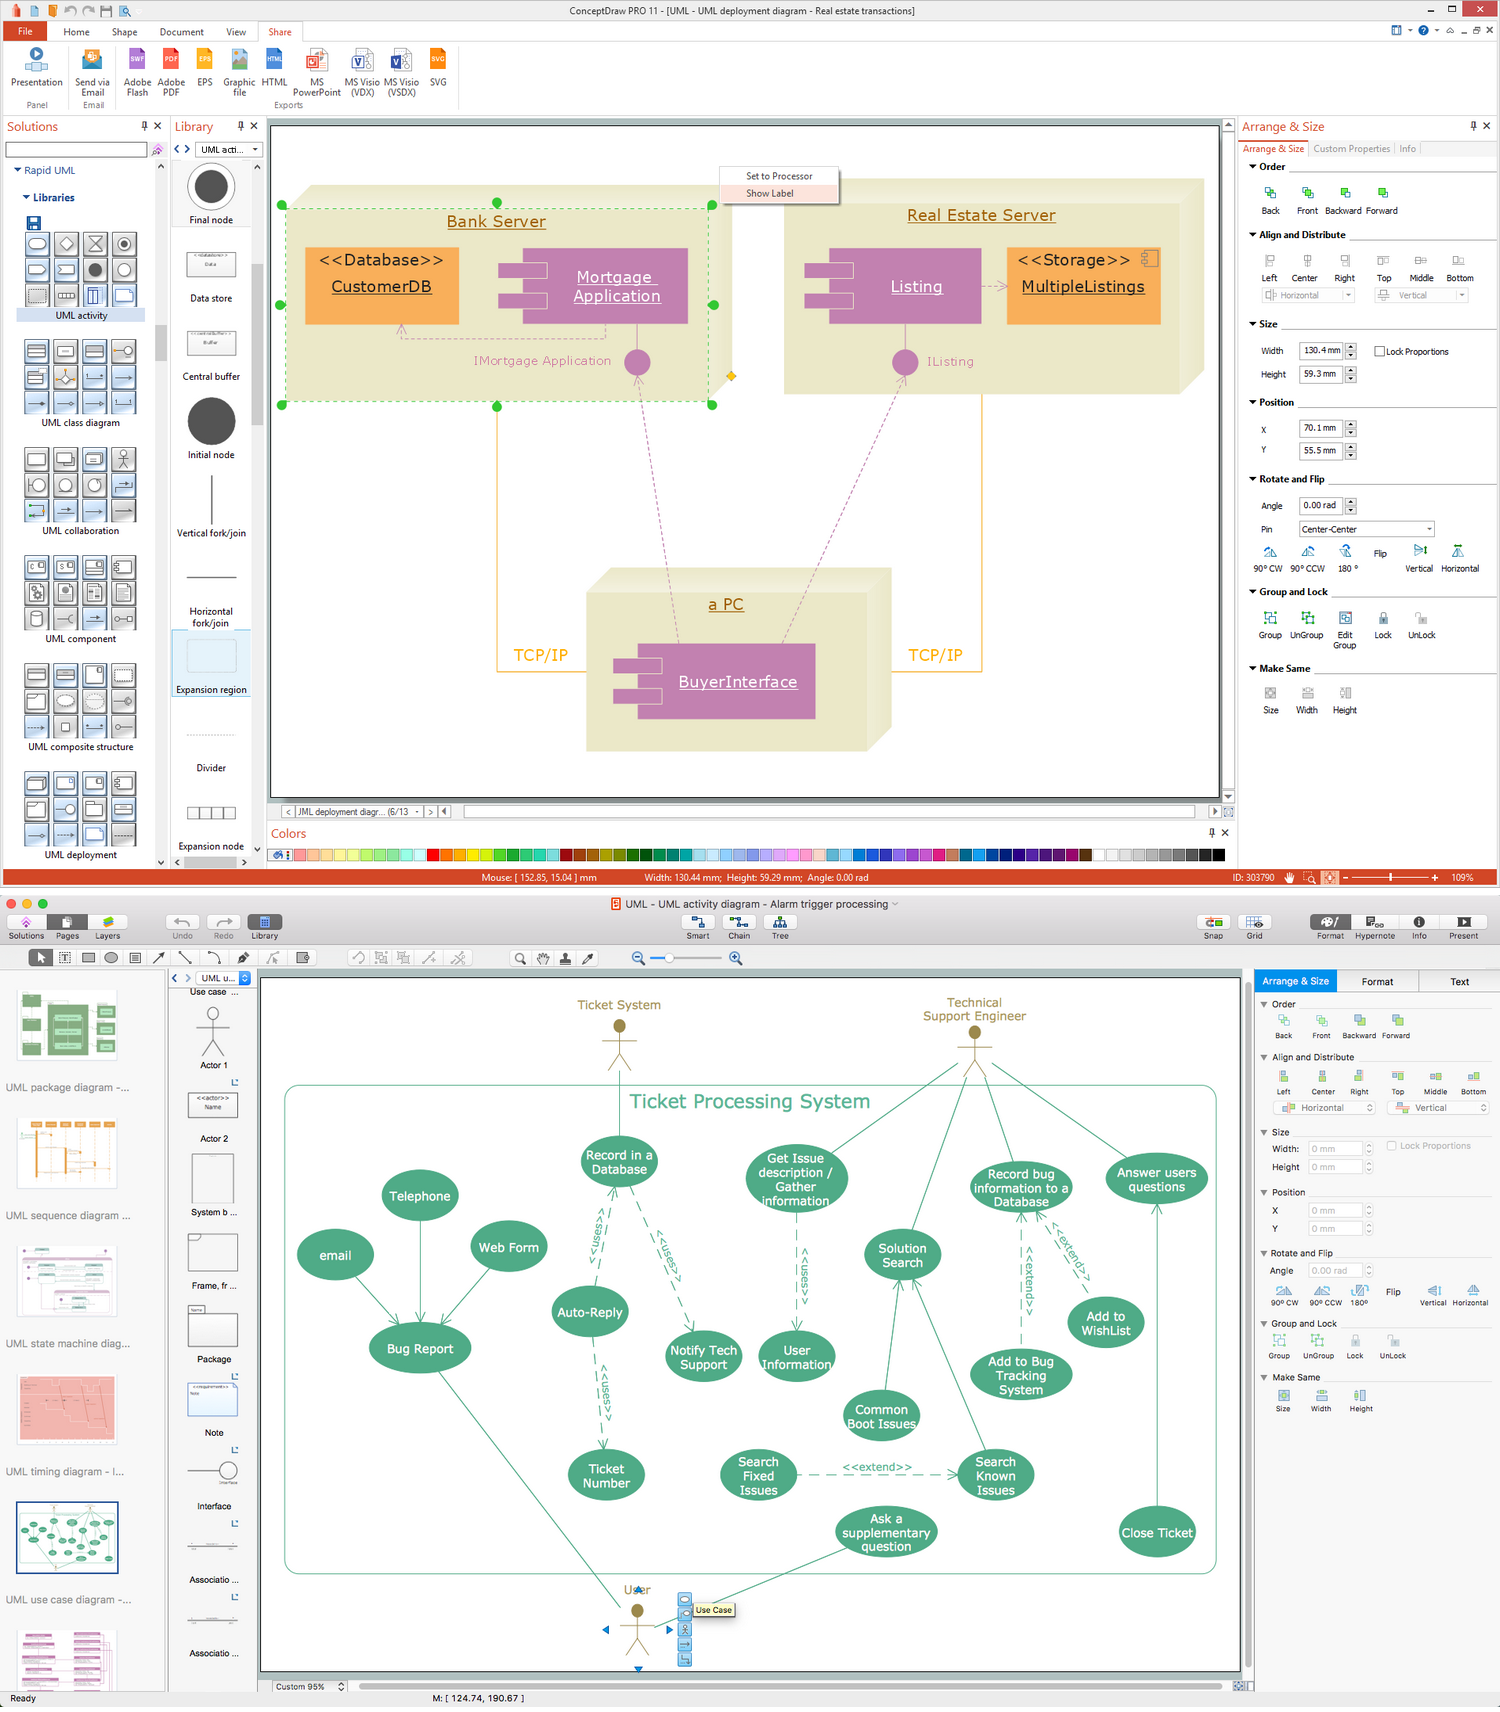
UML diagrams of business processes. The Rapid UML solution provides diagram examples, templates and vector stencils libraries for quick and easy drawing all types of UML 2.x and 1.x diagrams: UML activity diagrams, UML communication (collaboration) diagrams, UML component diagrams, UML composite structure diagrams, UML deployment diagrams, UML interaction overview diagrams, UML object diagrams, UML package diagrams, UML sequence diagrams, UML state machine diagrams, UML timing diagrams, UML use case diagrams.Fishbone Diagram Example
Fishbone Diagram, also referred as Cause and Effect diagram or Ishikawa diagram, is a fault finding and problem solving tool. Construction of Ishikawa diagrams is quite complicated process and has a number of features. Fishbone Diagrams solution included to ConceptDraw Solution Park contains powerful drawing tools and a lot of examples, samples and templates. Each Fishbone diagram example is carefully thought-out by experts and is perfect source of inspiration for you.Affinity Diagram
The Affinity Diagram, also known as a KJ diagram, is a business tool invented for organization the large quantity of ideas and data. It is a part of Seven Management and Planning Tools, it is usually used right after brainstorming to sort large numbers of ideas into the corresponding groups. The Affinity Diagram helps to represent in a better way the structure of large and complex factors which influence on a problem, divides these factors into the smaller and simpler structures, and helps team members to see the patterns and identify possible solutions to problems they have. The diagrams of this type don't show the causal relationships between the factors, but they are designed to prepare the data for holding further analysis of the cause-effect relationships. Another area of Affinity Diagram usage is contextual inquiry as a way to sort observations and notes from field interviews, support call logs, open-ended survey responses organizing, etc. ConceptDraw MINDMAP software offers you the tools for easy holding brainstorming, generation ideas and creation MINDMAP Affinity Diagram.
 Concept Maps
The technique of concept mapping was developed as a constructive way of representing knowledge in science and increasing the meaningfulness of learning. Now, the creation of a concept map is extremely helpful when used in education as learning and teaching techniques that assist memorization. Concept maps are also used for idea generation in brainstorming sessions, and for detailing the structure of complex ideas.
Mind Maps for Business - SWOT Analysis
SWOT analysis is a planning method and the best way for effective exploring four major aspects for a business or a venture - strengths, weaknesses, opportunities and threats. Visually SWOT analysis results are depicted as a SWOT matrix, diagram or Mind Map, which is then included to the set of documents, report or in presentation devoted to demonstration the results of realized SWOT analysis for directors, shareholders, and other interested employees. ConceptDraw Solution Park includes the SWOT and TOWS Matrix Diagrams solution, which offers wide possibilities for realization SWOT analysis and creation SWOT Matrices and SWOT Mind Maps in ConceptDraw DIAGRAM and ConceptDraw MINDMAP software. This solution includes fully ready-to-use SWOT vector design elements, SWOT matrix samples and also useful templates that allow users create own SWOT diagrams and Mind Maps for business SWOT analysis in a few minutes. Use also the perfect ability of instantly exporting to various formats and of creation MS PowerPoint presentation right from the ConceptDraw applications.Preparation for a Trip
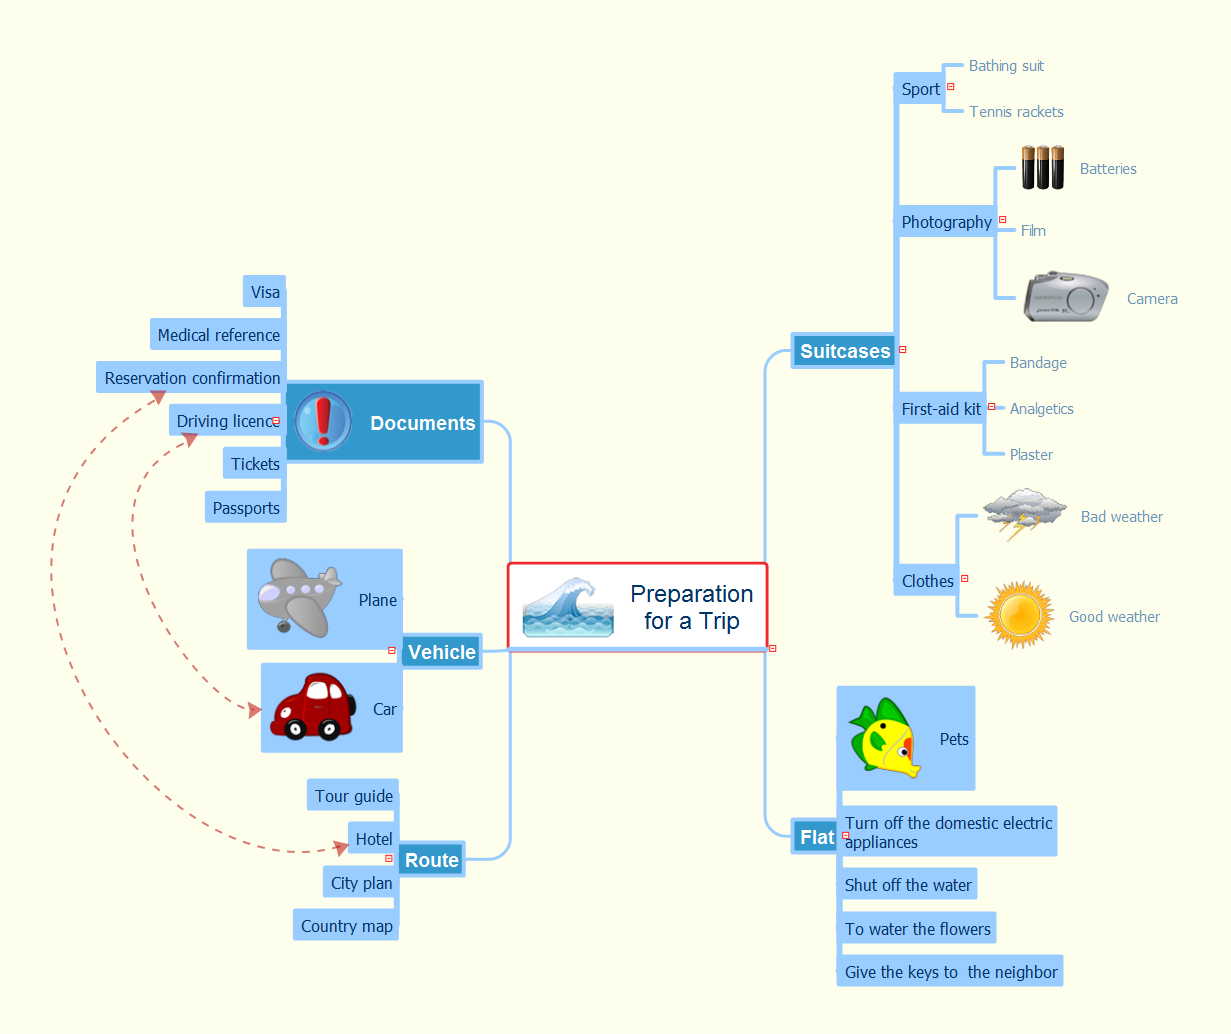
Our travel begins long before it starts, it is born from our dream, which we turn with time into reality. The planning and preparation are already the part of your trip, so you need to devote them sufficient time, to obtain as a result the most vivid impressions and memories of your trip. The preparation for the traveling is usually quite lengthy process during which you need to consider many things. First, you need to decide exactly where you want to travel and determine the purpose of the trip, maybe you want to learn more about new country, to learn new language, to find new friends, to make photos on the background of well known sights. Think about this, write your goals clearly and understandably. After that, further planning of travel becomes much easier and more enjoyable. Now you need to plan the order of visiting the countries, if you will go to several, to think about what you want to see your trip, whether this will be active rest or relaxing, what documents are needed for realization your dream, which kind of transport will help you to get to the right place and to compose a list of things you take to the trip. Enjoy your trip and plan it easy in ConceptDraw MINDMAP software.
 Fishbone Diagrams
The Fishbone Diagrams solution extends ConceptDraw DIAGRAM software with the ability to easily draw the Fishbone Diagrams (Ishikawa Diagrams) to clearly see the cause and effect analysis and also problem solving. The vector graphic diagrams produced using this solution can be used in whitepapers, presentations, datasheets, posters, and published technical material.
 Seven Management and Planning Tools
Seven Management and Planning Tools solution extends ConceptDraw DIAGRAM and ConceptDraw MINDMAP with features, templates, samples and libraries of vector stencils for drawing management mind maps and diagrams.
 Aerospace and Transport
This solution extends ConceptDraw DIAGRAM software with templates, samples and library of vector clipart for drawing the Aerospace and Transport Illustrations. It contains clipart of aerospace objects and transportation vehicles, office buildings and anci
Examples of Flowcharts, Org Charts and More
ConceptDraw DIAGRAM covers a broad spectrum of business graphics categories and offers at ConceptDraw STORE enormous online collection of pictorial examples and samples for different thematics and application areas. It is a plentiful source of inspiration and wonderful examples of professionally designed diagrams, flowcharts, UML diagrams, organizational charts, databases, ERDs, network diagrams, business charts, different thematic charts, schematics, infographics and plans developed specially for knowledge workers, engineers, managers, businessmen, marketing specialists, analytics, scientists, students, professors, journalists and also for a large number of other people that every day use various diagrams and drawings in their work and life activity. Each of these examples is a real art, all they are well thought-out and designed without efforts with help of powerful tools of ConceptDraw DIAGRAM software. ConceptDraw examples display all variety of tasks, possibilities and results that ConceptDraw Product Line lets achieve fast and easy. ConceptDraw is one of the best Visio alternatives for Mac. It open all Visio formats like.vsdx,.vss,.vdx files and allows you to export files to Visio formats.
 Calendars
Calendars solution extends ConceptDraw DIAGRAM software with templates, samples and library of vector stencils for drawing the business calendars and schedules.
How To Create a Bubble Chart
Bubble diagrams solution extends ConceptDraw DIAGRAM software with templates, Using ConceptDraw Connectors, you can create a bubble chart in moments. Using ConceptDraw you will be able to create a bubble chart from the ready ConceptDraw library objects or make your own objects. The created diagram can represent ideas organization, in brainstorming processes, by teachers for explaining difficult ideas or for presentations.When To Use a Fishbone Diagram
Fishbone diagrams work for most entrepreneurs and almost any industry or person having a problem. Professional diagramming software may help you create Fishbone (Cause and Effect or Ishikawa) diagrams. When people are unclear about what is causing an issue, ConceptDraw DIAGRAM will be your lifesaver. When to use a Fishbone diagram? Originally developed as a quality control tool, you may find a Fishbone diagram helpful when used in many cases, such as to analyze a complex problem when there are many causes, for identifying all possible root causes for an effect or a problem, when you need different point of view to look on a problem, to uncover bottlenecks and identify where and why a process doesn't work, for acceleration a process when traditional ways of problem solving consume many time.Ishikawa Diagram
In almost every sphere of life and work the people time to time are faced with the fact that on their way there are certain obstacles and problems. But it is not always possible to identify the true cause of particular problem. To understand the basic causes of problems and eliminate them, it is convenient to use the chart of Kaoru Ishikawa - the technique specially designed for this. ConceptDraw DIAGRAM diagramming and vector drawing software extended with Fishbone Diagrams solution from the Management area can help you with construction the Fishbone Diagram also known as Ishikawa Diagram. Ishikawa Diagram shows factors of Equipment, Process, People, Materials, Environment and Management, all affecting the overall problem in one drawing for the further analysis. It is a well effective way to analyze the business problems you must identify and solve.
 Scrum Workflow
The Scrum Workflow Solution extends the capabilities of ConceptDraw DIAGRAM with a large collection of professionally-designed samples and a selection of ready-to-use scrum design elements: scrum diagrams and arrows, scrum icons of people, artifacts, workflow, workspace and other colorful scrum clipart, and also scrum charts.
Presentation Preparation using Mind Maps
Whenever you need quick presentations, the ability to choose specific content, the ability to focus on specific stakeholder needs, update data, or create polished slide decks — ConceptDraw MINDMAP provides a presentation solution for you.- Brainstorming About Sport
- Sports Brainstorming Examples
- Brainstorming Graph About Sports And Games
- Winter Sports . Illustrations and Visualize Statistics | Winter Sports ...
- Soccer (Football) Dimensions | Soccer (Football) Illustrated | Soccer ...
- Positioning Example Marketing Sport
- Winter Olympics - Figure skating | Winter Sports Vector Clipart ...
- Process Flowchart | Concept Maps | Sport Field Plans | Concept ...
- Winter Sports | Mind Map Making Software | Flowchart Example ...
- Winter Sports Vector Clipart. Medal Map. Spatial Infographics ...
- Sports bar - Floor plan | Office Layout Plans | Bubble Diagrams ...
- Winter Sports . Olympic Games Illustrations. Medal Summary | Winter ...
- Flow Chart for Olympic Sports | Gant Chart in Project Management ...
- Food Court | Winter Sports | Bubble Diagrams | Erd On Super Store ...
- Winter Sports Vector Clipart. Medal Map. Spatial Infographics ...
- Dfd Diagram For Sports Shop
- Winter Sports | Winter Sports . Olympic Games Infographics. Medal ...
- Sport pictograms. Olympic Games | Speed skating - Winter sports ...
- Sports Management Swot Analysis Pyramid
- Sports bar - Floor plan | How To Create Restaurant Floor Plan in ...
