This site uses cookies. By continuing to browse the ConceptDraw site you are agreeing to our Use of Site Cookies.
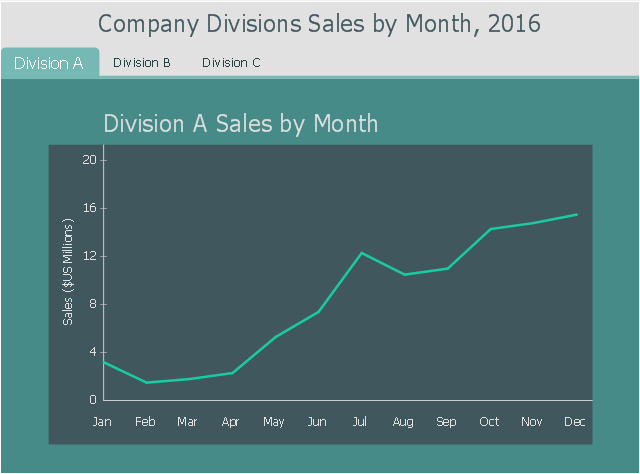
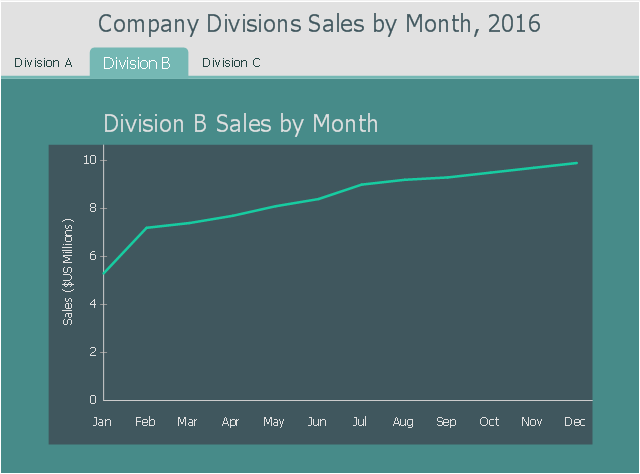
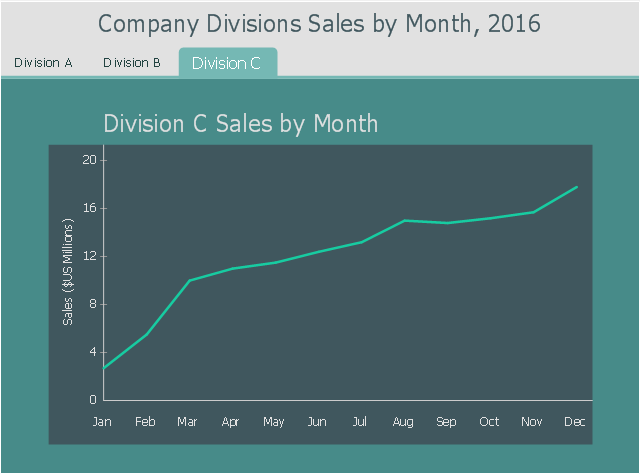
This business intelligence dashboard sample shows the company divisions sales by Month in 2016 using time series line charts.
"A time series is a series of data points indexed (or listed or graphed) in time order. Most commonly, a time series is a sequence taken at successive equally spaced points in time. Thus it is a sequence of discrete-time data. ... Time series are very frequently plotted via line charts." [Time series. Wikipedia]
The BI dashboard example "Company Divisions Sales by Month, 2016" was created using ConceptDraw PRO software extended with the Business Intelligence Dashboards solution from the Business Processes area of ConceptDraw Solution Park.
Division A
Division A, tab set, tab bar, serial line chart, line graph, checkbox,
Division B
Division B, tab set, tab bar, serial line chart, line graph, checkbox,
Division C
Division C, tab set, tab bar, serial line chart, line graph, checkbox,

bi dashboard, business intelligence solutions, dynamic chart, bi chart Business Intelligence Dashboard

bi dashboard, business intelligence solutions, dynamic chart, bi chart
Business Intelligence Dashboard solution extends the ConceptDraw PRO v11 functionality with exclusive tools, numerous ready-to-use vector objects, samples and quick-start templates for creation professional Business Intelligence Dashboards, Business Intelligence Graphics, Business Intelligence Charts and Maps of different kinds. Design easy the BI dashboard, BI model or Dynamic chart in ConceptDraw PRO to monitor the company's work, to track the indicators corresponding your company's data, to display and analyze key performance indicators, to evaluate the trends and regularities of the processes occurring at the company.

Matrix Organization Structure

Matrix organizational structure is one of the main forms of structures which is actively used by organizations to carry forth the functions of a company visually and effectively. Now we have ConceptDraw PRO diagramming and vector drawing software extended with 25 Typical Orgcharts solution from the Management area of ConceptDraw Solution Park which will help easy represent matrix organizational structure of any degree of complexity.

Sales Process Flowchart. Flowchart Examples

Sales Process Flowchart is an invaluable tool for business. It gives you opportunity to visualise and better understand the sales process, reveal and also visually highlight issues or bottlenecks, and predict the number of sales. The Flowchart is ideal method to represent in details all steps of the process, tasks and decisions needed to obtain maximum effectiveness and success. The steps are graphically represented by boxes linked with arrows indicating direction of the workflow, decision is shown by diamond. The sales process is closely linked to the company's success and usually includes the following main steps: Product knowledge, Prospecting, Planning the sale (Pre-approach), Approach, Need assessment, Presentation, Meeting objections, Gaining commitment, Follow-up. Create fast and easy your own Flowcharts of sales business processes using the ConceptDraw PRO vector graphic software extended with Cross-Functional Flowcharts solution from Business Processes area and also Sales Flowcharts solution from Marketing area of ConceptDraw Solution Park.

Process Flowchart

The main reason of using Process Flowchart or PFD is to show relations between major parts of the system. Process Flowcharts are used in process engineering and chemical industry where there is a requirement of depicting relationships between major components only and not include minor parts. Process Flowcharts for single unit or multiple units differ in their structure and implementation. ConceptDraw PRO is Professional business process mapping software for making Process flowcharts, Process flow diagram, Workflow diagram, flowcharts and technical illustrations for business documents and also comprehensive visio for mac application. Easier define and document basic work and data flows, financial, production and quality management processes to increase efficiency of your business with ConcepDraw PRO. Business process mapping software with Flowchart Maker ConceptDraw PRO includes extensive drawing tools, rich examples and templates, process flowchart symbols and shape libraries, smart connectors that allow you create the flowcharts of complex processes, process flow diagrams, procedures and information exchange. Process Flowchart Solution is project management workflow tools which is part ConceptDraw Project marketing project management software. Drawing charts, diagrams, and network layouts has long been the monopoly of Microsoft Visio, making Mac users to struggle when needing such visio alternative like visio for mac, it requires only to view features, make a minor edit to, or print a diagram or chart. Thankfully to MS Visio alternative like ConceptDraw PRO software, this is cross-platform charting and business process management tool, now visio alternative for making sort of visio diagram is not a problem anymore however many people still name it business process visio tools.
How To Create a Process Flow Chart (business process modelling techniques)

Flow Chart Diagram Examples

Draw your own business process flowcharts using ConceptDraw PRO diagramming and business graphics software.

organizational chart examples, business organizational chart, organogram, organigram, organizational structure , corporate hierarchy, organizational structure chart, organizational management , org chart maker, how to make an organizational chart, busines 25 Typical Orgcharts

organizational chart examples, business organizational chart, organogram, organigram, organizational structure , corporate hierarchy, organizational structure chart, organizational management , org chart maker, how to make an organizational chart, busines
The 25 Typical Orgcharts solution contains powerful organizational structure and organizational management drawing tools, a variety of professionally designed organization chart and matrix organization structure samples, 25 templates based on various orga

logistics management Logistic Dashboard

logistics management
The powerful tools of Logistic Dashboard solution and specially developed live graphic objects of logistic icons, logistic navigation elements, logistic indicators, logistic charts and logistic maps effectively assist in designing Logistic dashboards, Logistic maps, Logistic charts, diagrams and infographics. The included set of prebuilt samples and quick-start templates, demonstrates the power of ConceptDraw PRO software in logistics management, its assisting abilities in development, realization and analyzing the logistic processes, as well as in perfection the methods of logistics management.

logistics flow charts, logistics planning, logistics and supply chain, logistics management software, inventory flow chart Logistics Flow Charts

logistics flow charts, logistics planning, logistics and supply chain, logistics management software, inventory flow chart
Logistics Flow Charts solution extends ConceptDraw PRO v11 functionality with opportunities of powerful logistics management software. It provides large collection of predesigned vector logistic symbols, pictograms, objects and clipart to help you design with pleasure Logistics flow chart, Logistics process flow diagram, Inventory flow chart, Warehouse flowchart, Warehouse management flow chart, Inventory control flowchart, or any other Logistics diagram. Use this solution for logistics planning, to reflect logistics activities and processes of an enterprise or firm, to depict the company's supply chains, to demonstrate the ways of enhancing the economic stability on the market, to realize logistics reforms and effective products' promotion.

Basic Flowchart Symbols and Meaning

Flowcharts are the best for visually representation the business processes and the flow of a custom-order process through various departments within an organization. ConceptDraw PRO diagramming and vector drawing software extended with Flowcharts solution offers the full set of predesigned basic flowchart symbols which are gathered at two libraries: Flowchart and Flowcharts Rapid Draw. Among them are: process, terminator, decision, data, document, display, manual loop, and many other specific symbols. The meaning for each symbol offered by ConceptDraw gives the presentation about their proposed use in professional Flowcharts for business and technical processes, software algorithms, well-developed structures of web sites, Workflow diagrams, Process flow diagram and correlation in developing on-line instructional projects or business process system. Use of ready flow chart symbols in diagrams is incredibly useful - you need simply drag desired from the libraries to your document and arrange them in required order. There are a few serious alternatives to Visio for Mac, one of them is ConceptDraw PRO. It is one of the main contender with the most similar features and capabilities.
How to Build a Flowchart