This site uses cookies. By continuing to browse the ConceptDraw site you are agreeing to our Use of Site Cookies.

Flowchart Programming Project. Flowchart Examples

Create you own flow charts of process-driven software applications using the ConceptDraw DIAGRAM diagramming and vector drawing software extended with the Cross-Functional Flowcharts solution from the Business Processes area of ConceptDraw Solution Park. The programming project flow chart example shows the logical process of execution.
"Project planning is part of project management, which relates to the use of schedules such as Gantt charts to plan and subsequently report progress within the project environment.
Initially, the project scope is defined and the appropriate methods for completing the project are determined. Following this step, the durations for the various tasks necessary to complete the work are listed and grouped into a work breakdown structure. Project planning is often used to organize different areas of a project, including project plans, work loads and the management of teams and individuals. The logical dependencies between tasks are defined using an activity network diagram that enables identification of the critical path. Float or slack time in the schedule can be calculated using project management software. Then the necessary resources can be estimated and costs for each activity can be allocated to each resource, giving the total project cost. At this stage, the project schedule may be optimized to achieve the appropriate balance between resource usage and project duration to comply with the project objectives. Once established and agreed, the project schedule becomes what is known as the baseline schedule. Progress will be measured against the baseline schedule throughout the life of the project. Analyzing progress compared to the baseline schedule is known as earned value management.
The inputs of the project planning phase include the project charter and the concept proposal. The outputs of the project planning phase include the project requirements, the project schedule, and the project management plan." [Project planning. Wikipedia]
The flow chart example "Project planning process" was created using the ConceptDraw PRO diagramming and vector drawing software extended with the Flowcharts solution from the area "What is a Diagram" of ConceptDraw Solution Park.
Flowchart - Project planning process
Flowchart - Project planning process, terminator, process,
Used Solutions

Best Vector Drawing Application for Mac OS X

ConceptDraw DIAGRAM creates drawings, diagrams and charts with great visual appeal in Mac OS X.

Value stream with ConceptDraw DIAGRAM

The Value stream is a totality of all actions on the projection, order composition and production: starting from creation a product project to launching this product, from order to delivery, from extraction of raw materials to ready product manufacturing. Value stream mapping is a process of visualization of these actions and creation of a detailed and graphical map.

Mechanical Engineering

ConceptDraw DIAGRAM is the best diagramming and vector drawing software. Now, enhanced with Mechanical Engineering solution from the Engineering area of ConceptDraw Solution Park it became ideal for creating: Technical Mechanical Drawings, Mechanical Engineering Diagrams, Pneumatic Schematics, Hydraulic Schemes, etc.

Program Evaluation and Review Technique (PERT) with ConceptDraw DIAGRAM

Program Evaluation and Review Technique (abbr. PERT) is a method developed by Ministry of Defense of the USA in 1958 for the project of creation the missile system Polaris. PERT diagram is one of the tools for project management that lets greatly simplify the planning and scheduling of large and complex projects. PERT diagram provides evaluation of project run-time and labor forces, it helps to analyze the time necessary for execution each of project tasks and the whole project, and to calculate the project critical path. PERT chart depicts the set of tasks connected each other in order of their execution and is constructed according to one of definite rules - AOA (activity on arrow) or AON (activity on node). It doesn't give you ready concrete decisions, but helps to find them. Design easy the PERT diagrams in ConceptDraw DIAGRAM software enhanced with Seven Management and Planning Tools solution from Management area of ConceptDraw Solution Park. You have a possibility to build the PERT chart of any type, but AON variant is easier for building and perception.

E-R Diagrams

Complexity of databases increases day by day, due to this the Entity relationship models and E-R diagrams become more and more popular, and now are an important part of database design. E-R diagrams created at ConceptDraw DIAGRAM allow visually and graphically represent structure and design of databases.

Product Overview

ConceptDraw PROJECT is a vigorous tool for managing single or multiple projects. It lets you determine all essential elements involved into project, control schedules, resources and finances, and monitor projects' progress in most effective yet simple manner.

Product Overview

ConceptDraw DIAGRAM offers a wide choice of powerful and easy-to-use tools for quickly creating all kinds of charts and diagrams. Even if you've never used a drawing tool before, it's very easy to create high-quality professional graphic documents with ConceptDraw DIAGRAM.

Express-G Diagram

The vector stencils library from the solution Information Model Diagrams contains specific data type symbols of the EXPRESS-G notation such as entity data type symbols, simple data type symbols, enumeration data type symbols, defined data type symbols, select data type symbols and specific attribute symbols for ConceptDraw DIAGRAM diagramming and vector drawing software. The Information Model Diagrams solution is contained in the Software Development area of ConceptDraw Solution Park.

Android GUI

Android is an operating system based on the Linux kernel and developed by Google for smartphones, tablet computers, electronic books, netbooks, smartbooks, digital players, watches, game consoles, TV and other devices. ConceptDraw DIAGRAM extended with Android User Interface Solution from the Software Development Area is a powerful software with extensive drawing tools which can help you to build the intelligible, attractive and easy for perception Android GUI for your application.

Keyboard Shortcuts and Mouse Actions

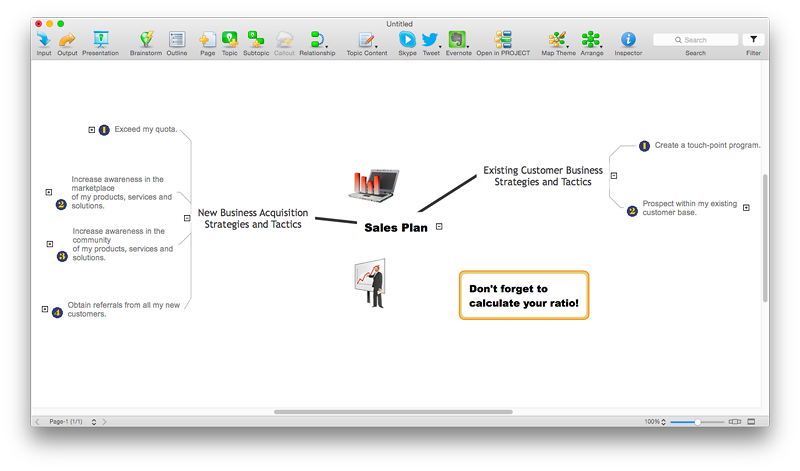
Mind Maps are an advanced technique used to solve a wide range of professional tasks, personal growth tasks, business tasks, household tasks that occur in everyday life. When you need to make a difficult decision in terms of lack of information, to prepare a report, design a presentation in original way, to organize a brainstorming session, to develop plan for the next week / month / year, to make notes during the lecture, in all these cases the mind mapping technique will be effective. The essence of the method consists in structuring the information, in visualization of objects and concepts, and also in setting the associative relationships. This method is popular in teaching and when explaining new information, and lets represent it in a concise and easily perceived form. Mind Maps can be also effectively used to represent different computer knowledge and helpful information about the use of different applications. ConceptDraw MINDMAP is powerful software for designing different Mind Maps, including the Mind Map demonstrating the keyboard shortcuts and mouse actions that are utilized in ConceptDraw MINDMAP.

one-line diagram, single-line diagram, electrical diagram, engineering diagram, electrical symbol, one-line drawing One-line Diagrams

one-line diagram, single-line diagram, electrical diagram, engineering diagram, electrical symbol, one-line drawing
One-line Diagrams solution is a powerful electrical engineering tool to develop precise and detailed One-line Diagram, Single-line Diagram, Electrical diagram. This solution supplies the ConceptDraw DIAGRAM users with a wide set of vector libraries with special icons and electrical symbol elements for one-line drawing and electrical engineering diagram design including. It includes a large collection of samples of One-line Diagrams illustrating high-voltage and low-voltage systems, different electrical configurations and topologies, transmission systems, application of circuit breakers, protection electrical equipment, etc. It is perfect for all power-related workers, engineers, electricians, and other professionals working in power engineering and energy industries.

Object-Oriented Design

ConceptDraw DIAGRAM is a powerful diagramming and vector drawing software. Now, extended with IDEF Business Process Diagrams solution from the Business Processes area of ConceptDraw Solution Park it is incredibly helpful and convenient for object-oriented design.

Is ConceptDraw DIAGRAM an Alternative to Microsoft Visio?

Visio for Mac and Windows - ConceptDraw as an alternative to MS Visio. ConceptDraw DIAGRAM delivers full-functioned alternative to MS Visio. ConceptDraw DIAGRAM supports import of Visio files. ConceptDraw DIAGRAM supports flowcharting, swimlane, orgchart, project chart, mind map, decision tree, cause and effect, charts and graphs, and many other diagram types.

green energy infographics, solar power, renewable energy, cleaner energy, how do solar panels work, wind power, hydropower, tidal power Green Energy

green energy infographics, solar power, renewable energy, cleaner energy, how do solar panels work, wind power, hydropower, tidal power
Green Energy solution extends the ConceptDraw DIAGRAM functionality with a large collection of vector design icons, pictograms, and clipart useful to design green energy infographics and illustrations of any kind. Create overview infographics about solar power, wind power, hydropower, tidal power and other renewable and cleaner energy sources. Compare visually different types of energy or data over several years in one chart. Develop detailed infographics about power generation mechanisms, how do solar panels work, wind and tidal turbines, and more specialized power generation equipment.

energy, oil and gas, energy industry, oil industry, oil and gas industry infographics, oil and gas symbols, oil and gas graphics Oil and Gas

energy, oil and gas, energy industry, oil industry, oil and gas industry infographics, oil and gas symbols, oil and gas graphics
The Oil and Gas solution for ConceptDraw DIAGRAM software provides vector libraries of oil and gas symbols and a collection of samples for quick and simple designing of the oil and gas industry infographics, illustrations, presentations, diagrams. The resulting oil and gas graphics and illustrations help to clearly and quickly detail complex information. They are ideal for reporting on the development of best practices in oil and gas exploration and production. Use them to illustrate growth strategies and trends in the oil industry, conduct analysis, forecast the energy industry, and present the results of international energy forums.

Interior Design. Piping Plan — Design Elements

The pipe laying and setting the plumbing system at new apartment or home, or replacing the worn plumbing begins from the choice of materials, sizes of pipes and creation the plan. When developing a piping system, the engineer should take into account many aspects, such as advantages and disadvantages of different pipes materials, the temperature changes (freezing or thermal expansion) that effect on pipes. The most commonly used are steel pipes which have passed the test of time, but they are difficult for assembling and prone to corrosion, plastic (polypropylene) pipes that are characterized by low weight and price, ease of installation and durability, and also PEX-AL-PEX pipes. Numerous libraries with ready-to-use design elements of pipes, valves and other plumbing and piping equipment included to Plumbing and Piping Plans solution for ConceptDraw DIAGRAM help easy design Piping and Plumbing interior design plans, blueprints, schematic diagrams, technical drawings of waste water disposal systems, hot and cold water supply systems.

java class. object oriented, object oriented programming concepts, classes, object oriented programming, python class Class Hierarchy Tree

java class. object oriented, object oriented programming concepts, classes, object oriented programming, python class
Class Hierarchy Tree solution enhances the ConceptDraw DIAGRAM and ConceptDraw MINDMAP software functionalities with a wide collection of samples and a large set of pre-made vector shapes, smart and direct connectors allowing all IT and web specialists, web-designers, web-programmers, and lecturers to design the Class Hierarchy Trees and Class Diagrams, object oriented classes, making easier the object oriented programming, illustrating the object oriented programming concepts, the generalization and inheritance in Java class and Python class, as well as designing the Class Hierarchy Mind Maps and autogenerating them in Class Tree Diagrams in ConceptDraw DIAGRAM files.