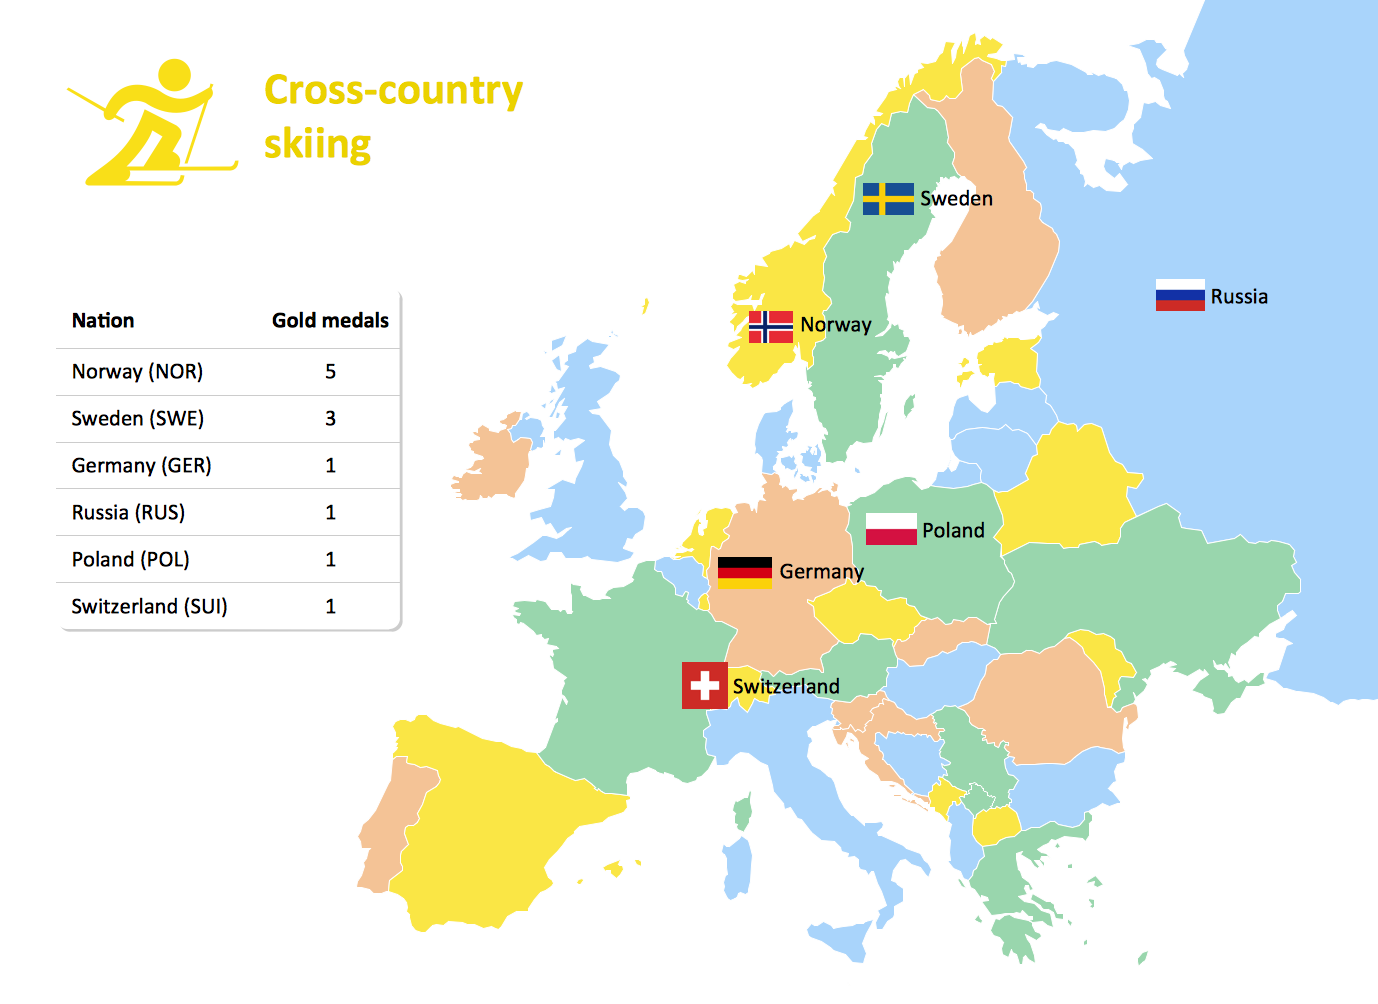
Winter Sports. Olympic Games Infographics. Medal Table
Visualizing data in infographics format is a modern way to represent any statistics related to global sporting events, such as Winter Olympic Games. ConceptDraw PRO software extended with the Winter Sports solution delivers a rich set of samples and templates helps you produce all kind of sporting information, such as tournament schedule or medal table.Typography Graphic
You want design Typography Graphic and need powerful infographic software? Then ConceptDraw PRO extended with Typography Infographics Solution from the “Infographics” Area is exactly what you need. Typography Infographics Solution offers you: large quantity of infographic examples; 9 libraries with numerous collection of predesigned vector objects that will help you design your own typography graphic of any complexity and design. Use ConceptDraw STORE to quickly get the access for the Typography Infographics Solution tools.Basic Diagramming
Create flowcharts, organizational charts, bar charts, line graphs, and more with ConceptDraw PRO.
Process Flowchart
The main reason of using Process Flowchart or PFD is to show relations between major parts of the system. Process Flowcharts are used in process engineering and chemical industry where there is a requirement of depicting relationships between major components only and not include minor parts. Process Flowcharts for single unit or multiple units differ in their structure and implementation. ConceptDraw PRO is Professional business process mapping software for making Process flowcharts, Process flow diagram, Workflow diagram, flowcharts and technical illustrations for business documents and also comprehensive visio for mac application. Easier define and document basic work and data flows, financial, production and quality management processes to increase efficiency of your business with ConcepDraw PRO. Business process mapping software with Flowchart Maker ConceptDraw PRO includes extensive drawing tools, rich examples and templates, process flowchart symbols and shape libraries, smart connectors that allow you create the flowcharts of complex processes, process flow diagrams, procedures and information exchange. Process Flowchart Solution is project management workflow tools which is part ConceptDraw Project marketing project management software. Drawing charts, diagrams, and network layouts has long been the monopoly of Microsoft Visio, making Mac users to struggle when needing such visio alternative like visio for mac, it requires only to view features, make a minor edit to, or print a diagram or chart. Thankfully to MS Visio alternative like ConceptDraw PRO software, this is cross-platform charting and business process management tool, now visio alternative for making sort of visio diagram is not a problem anymore however many people still name it business process visio tools.
Table Seating Chart Template
The arrangement of tables and seating charts near them have great value in many premises and situations. It is often very convenient to draw a plan before the furniture arrangement. ConceptDraw PRO software offers the Seating Plans solution from the Building Plans area for fast and easy drawing the table seating chart template and samples.Winter Sports Vector Clipart. Medal Map. Spatial Infographics
Tracking Olympic results in visual format is the most modern way to deliver statistics to a broad audience. This is a good example of an illustrated table you may easily modify, print, or publish on web from ConceptDraw Winter Sports solution .Football – 2014 FIFA World Cup Standings Group
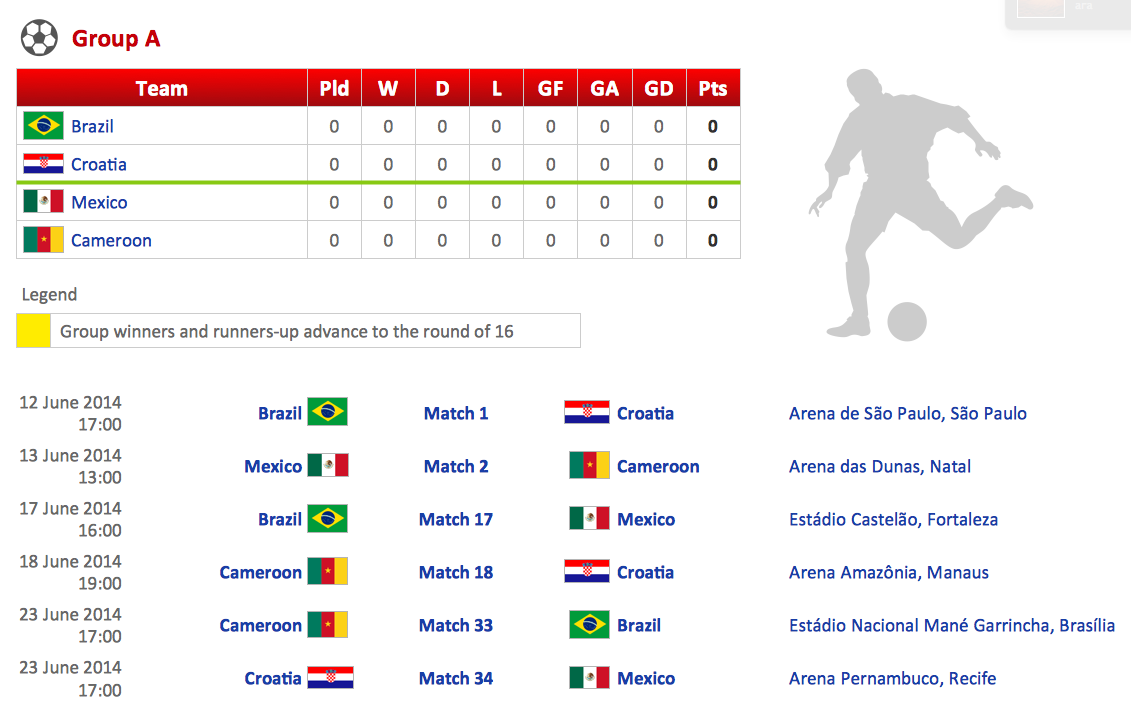
You can see the samples representing the 2014 FIFA World Cup schedules and tournament tables for each of eight groups. These samples was created in ConceptDraw PRO using the “FIFA World Cup 2014 team flags”, “Soccer pictograms” and “Soccer silhouettes” libraries from the Soccer solution from the Sport area of ConceptDraw Solution Park.ERD Symbols and Meanings
Entity Relationship Diagram (ERD) is a popular software engineering tool for database modeling and illustration the logical structure of databases, which uses one of two notations - Chen's or Crow’s Foot. Crow's foot notation is effective when used in software engineering, information engineering, structured systems analysis and design. Each of these notations applies its own set of ERD symbols. Crow's foot diagrams use boxes to represent entities and lines between these boxes to show relationships. Varied shapes at the ends of lines depict the cardinality of a given relationship. Chen's ERD notation is more detailed way to represent entities and relationships. ConceptDraw PRO application enhanced with all-inclusive Entity-Relationship Diagram (ERD) solution allows design professional ER diagrams with Chen's or Crow’s Foot notation on your choice. It contains the full set of ready-to-use standardized ERD symbols and meanings helpful for quickly drawing, collection of predesigned ERD samples, examples and templates. ConceptDraw Pro is a great alternative to Visio for Mac users as it offers more features and can easily handle the most demanding professional needs.
Winter Sports. Using Winter Sports Design Elements Producing Infographics
The Winter Sports solution from Sport Area of ConceptDraw Solution Park contains winter sports pictogram you may use illustrating any kind of material about Olympic Games or any other sport competitions.Infographic Generator
ConceptDraw PRO extended with Typography Infographics Solution from the “Infographics” Area is the best Infographic Generator. Make sure in it right now! Typography Infographics Solution offers you the best numerous collection of predesigned infographics examples and 9 libraries with large quantity of ready-to-use vector stencils that will help you design your own Typography Infographics of any complexity in minutes..Home area networks (HAN). Computer and Network Examples
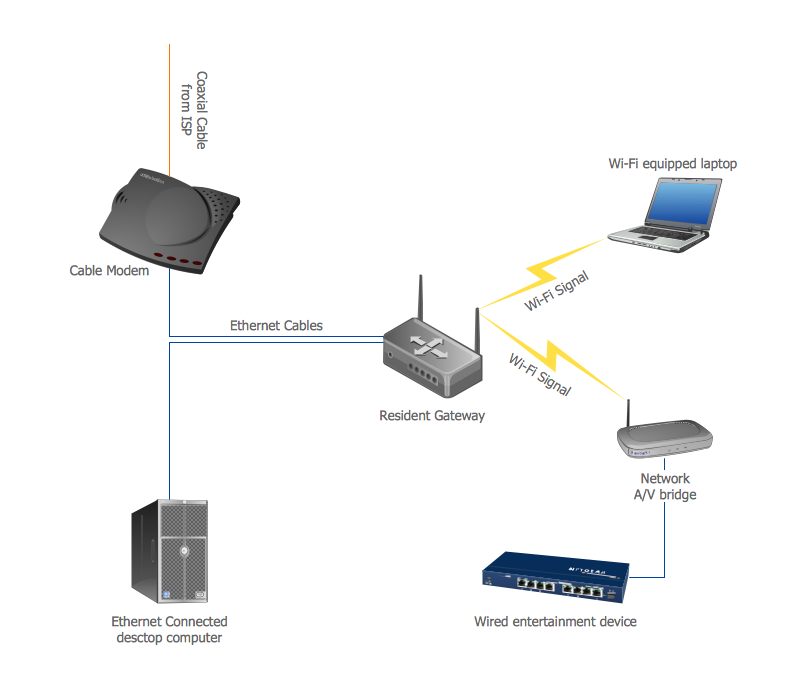
A Home Area Networks (HAN) is a type of local area network that is used in an individual home. The home computers can be connected together by twisted pair or by a wireless network. HAN facilitates the communication and interoperability among digital devices at the home, allows to easier access to the entertainments and increase the productivity, organize the home security. This example was created in ConceptDraw PRO using the Computer and Networks Area of ConceptDraw Solution Park and shows the home network diagram.
EIGRP. Computer and Network Examples
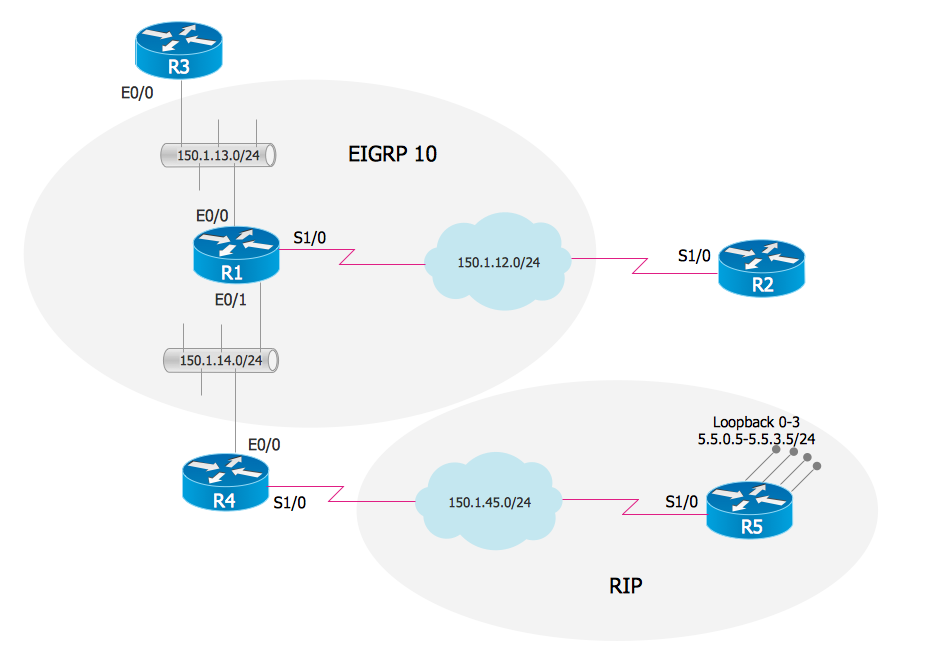
The Enhanced Interior Gateway Routing Protocol (EIGRP) is a progressive distance-vector dynamic routing protocol. It was developed by the Cisco Systems and is available as an open standard from 2013. EIGRP is used to help automate routing decisions and configuration of the computer network. It allows the routers of the same logical area automatically share route information.
Venn Diagram Examples for Problem Solving. Venn Diagram as a Truth Table
Venn diagrams are illustrations used in the branch of mathematics known as set theory. They show the mathematical or logical relationship between different groups of things (sets). A Venn diagram shows all the possible logical relations between the sets.Azure Storage
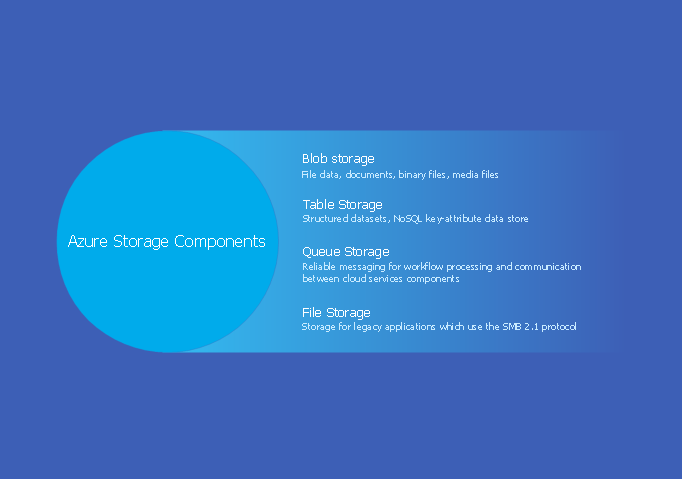
Data storage is a fundamental aspect of the cloud platform. Microsoft offers scalable, durable and elastic cloud Azure Storage which can be available from any type of application whether it’s running in the cloud and anywhere in the world. ConceptDraw PRO diagramming and vector drawing software extended with Azure Architecture Solution from the Computer and Networks area of ConceptDraw Solution Park provides a lot of useful tools which give you the possibility effectively illustrate Microsoft Azure cloud system, Azure services, Azure storage and its components.- Example Of Graphic Communication Tables
- Tables In Graphic Communication
- Winter Sports. Olympic Games Infographics. Medal Table | Area ...
- Defination Of Graphics Pie Chart Bar Chart Table Flow Chart
- Example Of Graphic Communication Flow Chart
- Example Of Graphic Communication Diagrams
- Venn Diagram Examples for Problem Solving. Venn Diagram as a ...
- Venn Diagram Examples for Problem Solving. Venn Diagram as a ...
- Graphic Chart Of Communication In Organization
- Venn Diagram Examples for Problem Solving. Venn Diagram as a ...
- Bar Pie Flow Table Chart With Example Explanation
- Program Evaluation and Review Technique (PERT) with ...
- Design elements - Periodic table of chemical elements | How to ...
- Electronic Components Symbols Structure Table
- Design elements - Tables | Interior Design Office Layout Plan ...
- Electrical Engineering | Venn Diagram Examples for Problem ...
- How to Create a Typography Infographic Using ConceptDraw PRO ...
- Chemistry Drawings | Chemistry Drawing Software | Chemistry ...
- Design elements - Media | Media - Vector stencils library | CCTV ...
