Design Pictorial Infographics. Design Infographics

How to Make an Infographic

Infographic Maker

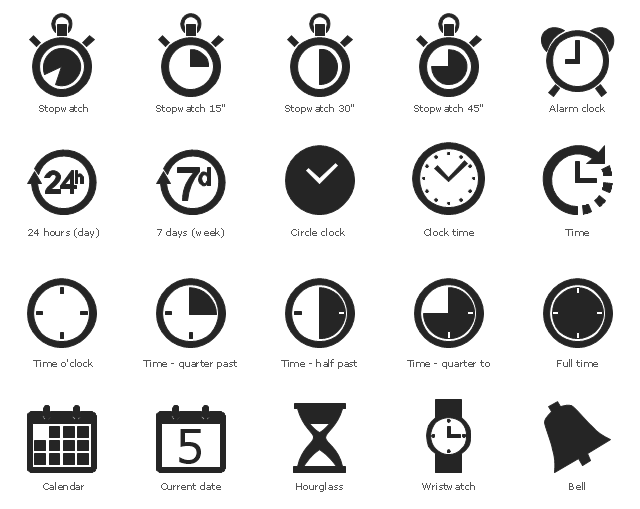
Use it to create temporal infographic, illustrations and diagrams.
The example "Time and clock pictograms - Vector stencils library" was created using the ConceptDraw PRO diagramming and vector drawing software extended with the Pictorial infographics solution from the area "What is infographics" in ConceptDraw Solution Park.


Chart Examples

Best Tool for Infographic Construction

Management Consultant

A management consultant is an important person for the company, he helps in the questions of improving business performance and increasing profits, he consults for the questions of business strategy, management and financial controls, resources, and also suggests recommendations for changing the structure of the company if needed.
So, every day management consultant conduct the complex work and often use the helpful management infographics for explain his thoughts and arguments to the company direction. Thanks to the development of computer technologies, drawing of management infographics is so easy today. ConceptDraw PRO diagramming and vector drawing software offers you the Management Infographics Solution from the Business Infographics Area.
 Time Series Dashboard
Use it to create temporal infographic, illustrations and diagrams.
The pictograms example "Design elements - Time and clock pictograms" was created using the ConceptDraw PRO diagramming and vector drawing software extended with the Pictorial Infographic solution from the area "What is infographics" in ConceptDraw Solution Park.
 PM Personal Time Management
How to Connect Text Data to a Time Series Chart on Your Live Dashboard


How to Create Data-driven Infographics

How to Create Management Infographics Using ConceptDraw PRO

- Spatial infographics Design Elements: Continental Map | How to ...
- Design Pictorial Infographics . Design Infographics | Time and clock ...
- Time Intervals
- Brilliant Examples of Infographics Map, Transport, Road | Examples ...
- Time and clock pictograms - Vector stencils library | Design ...
- Time and clock pictograms - Vector stencils library | Time - Design ...
- Time Sheet Infographic
- Design elements - Time and clock pictograms | Time and clock ...
- Time and clock pictograms - Vector stencils library | How To use ...
- Strategy Clock Template | Time - Design Elements | Basketball Court ...
- Time and clock pictograms - Vector stencils library | Time and clock ...
- Basketball Court Dimensions | Time and clock pictograms - Vector ...
- Australia Map Example
- Design Pictorial Infographics . Design Infographics | How to Draw ...
- Time - Design Elements | Time and clock pictograms - Vector ...
- Sample Time Line
- Map Infographic Design | Subway infographic design elements ...
- Design elements - Marketing pictograms | Design elements ...
- How to Create Management Infographics Using ConceptDraw PRO ...