 Spatial Infographics
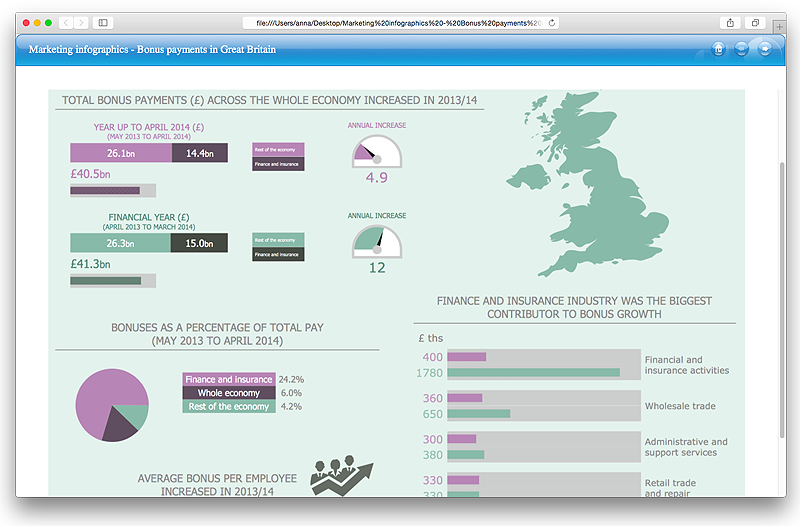
Spatial infographics solution extends ConceptDraw PRO software with infographic samples, map templates and vector stencils libraries with design elements for drawing spatial information graphics.
 Website Wireframe
The innovative Website Wireframe solution enhances the ConceptDraw PRO v10 functionality with newest wireframe tools, libraries with variety of predesigned icons, symbols, buttons, graphics, forms, boxes, and many other vector elements, templates and professionally designed samples, which make it the best wireframing software. Website Wireframe solution gives you significant advantages when designing and maintaining websites, creating skeletal and content-free depictions of website structure, making website prototypes and planning the content arrangement before committing to design, also speeds up the processes of sketching, producing and sharing wireframe examples of website style and interface design.
How to draw Metro Map style infographics? (London)
Tool to draw Metro Map styled inforgraphics. London Tube map sample.
 What are Infographic Area
Solutions of the area What is Infographics from ConceptDraw Solution Park collect templates, samples and vector stencils libraries with design elements for the drawing information graphics.
HelpDesk
How to Make a Web Page from Infographics in ConceptDraw PRO
Create your own original marketing illustrations and infographics, presentation slides, website, and blog pages using ConceptDraw PRO.HelpDesk
How to Create Data-driven Infographics
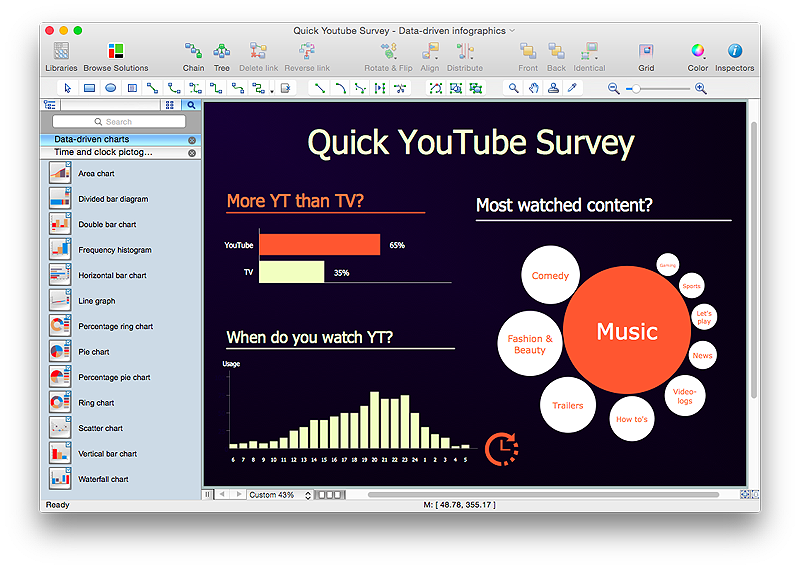
Data-driven infographics are used in wildly disparate areas of business and commerce. To make effective Data-driven infographics, it's useful to have a wide variety of graphical elements — icons, clipart, stencils, charts and graphs — to illustrate your diagram. ConceptDraw Data-driven Infographics solution provides all the tools you need to present data as described by this article — as well as the charts mentioned previously, you can find histograms, divided bar charts, ring charts, line graphs and area charts — meaning you can find the perfect medium for displaying a certain type of data. It allows you to draw data driven infographics quickly and easily using the special templates and vector stencils libraries.It can be used to quickly communicate a message, to simplify the presentation of large amounts of data, to see data patterns and relationships, and to monitor changes in variables over time.Chart Examples
Easy charting software comes with beautiful chart templates and examples. This makes it easy to create professional charts without prior experience.
 AWS Architecture Diagrams
The flexible AWS cloud solutions will help you to create reliable applications with a high level of scaling in the AWS cloud, to run your applications and accelerate their work on the level of security. Besides AWS resources are available worldwide and yo
 Cloud Computing Diagrams
The Cloud Computing Diagrams solution extends the functionality of the ConceptDraw PRO software with comprehensive collection of libraries of cloud computing vector stencils to help you get started design of Cloud Computing Diagrams and Architecture D
- Shopping Online | Design Pictorial Infographics . Design ...
- Infographic Online
- Process Flowchart | Hiring process workflow | Example of DFD for ...
- Internet Marketing Infographic | Internet marketing professions ...
- Typography Infographic Examples | Brilliant Examples of ...
- Website user profile | Account Flowchart. Flowchart Examples | UML ...
- Example of DFD for Online Store (Data Flow Diagram) DFD ...
- Flowchart Marketing Process. Flowchart Examples | Marketing Plan ...
- Example of DFD for Online Store (Data Flow Diagram) DFD ...
- Example of DFD for Online Store (Data Flow Diagram) DFD ...
- Context Diagram Template | Data Flow Diagram (DFD) | Example of ...
- What are Infographic Area | Social Media Response | Geo Map ...
- Gant Chart in Project Management | Online Marketing Objectives ...
- Sample Of Website Chart
- Sample Pictorial Chart. Sample Infographics | Line Chart Examples ...
- How to Add Data-driven Infographics to a MS Word Document Using ...
- Website Wireframe | Wireframing | How To Collaborate via Skype ...
- Website Wireframe | Online shop (wireframe) | Wireframing | Website ...
- Online store social media response flowchart | Social Media ...
- Social strategy - Pyramid diagram | Social Media Marketing ...


