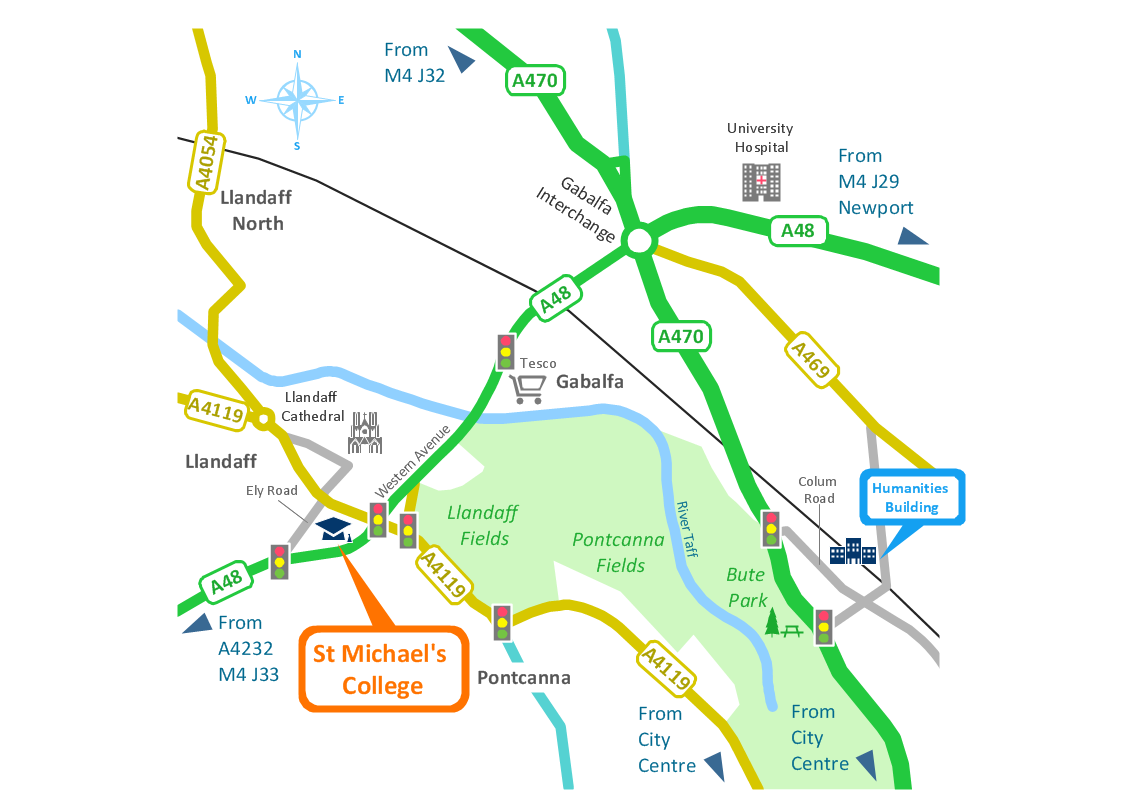
Brilliant Examples of Infographics Map, Transport, Road
ConceptDraw PRO contains spatial infographics samples, map templates to be filled in, and libraries of vector stencils for main design elements of spatial infographics.Typography Infographic Examples
ConceptDraw PRO extended with Typography Infographics Solution from the “What are Infographics” Area is a powerful infographic software that offers you variety of infographics examples. Use of predesigned examples as the base for your own Typography Infographics is a timesaving and useful way. Simply open the desired example, change for your needs and then successfully use it in any field of your activity.Superb Examples of Infographic Maps
Great examples of Infographic Maps, they are needed for inspiration.HelpDesk
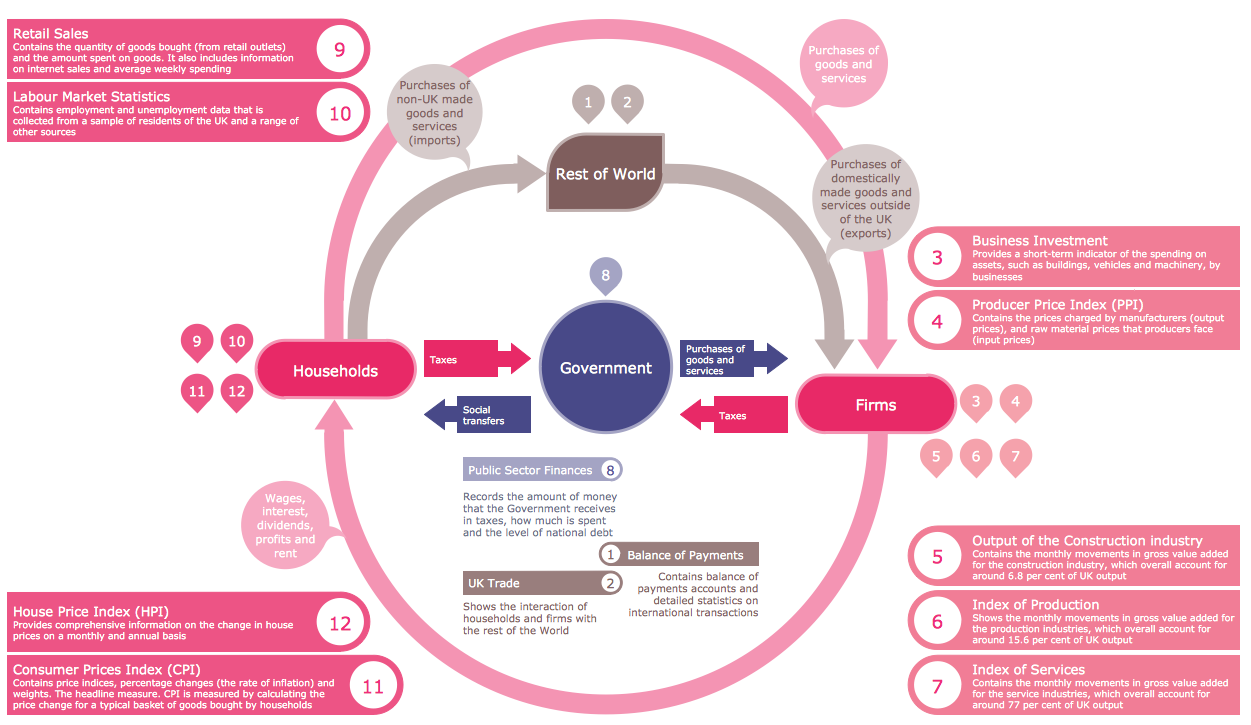
How to Create Management Infographics Using ConceptDraw PRO
Management might want to communicate a basic workflow for each division of the company, visualise business strategy and decision processes, or display a certain business training concept. In this case, an infographic can be more text heavy, and use illustrations to establish a timeline, process, or step-by-step sequence of events. ConceptDraw PRO can be used as a tool for creating management infographics. It allows you to draw infographics quickly and easily using the special templates and vector stencils libraries. Infographics can be used to quickly communicate a message, to simplify the presentation of large amounts of data, to see data patterns and relationships, and to monitor changes in variables over time. It can contain bar graphs, pie charts, histograms, line charts, e.t.c.Data Infographics
The popularity of visual Data Infographics grows day by day. So it would be nice to have effective software for their quick and easy creating. ConceptDraw PRO extended with Data-driven Infographics Solution from the “What are Infographics” Area of ConceptDraw Solution Park is exactly what you need.Excellent Examples of Infographic Maps
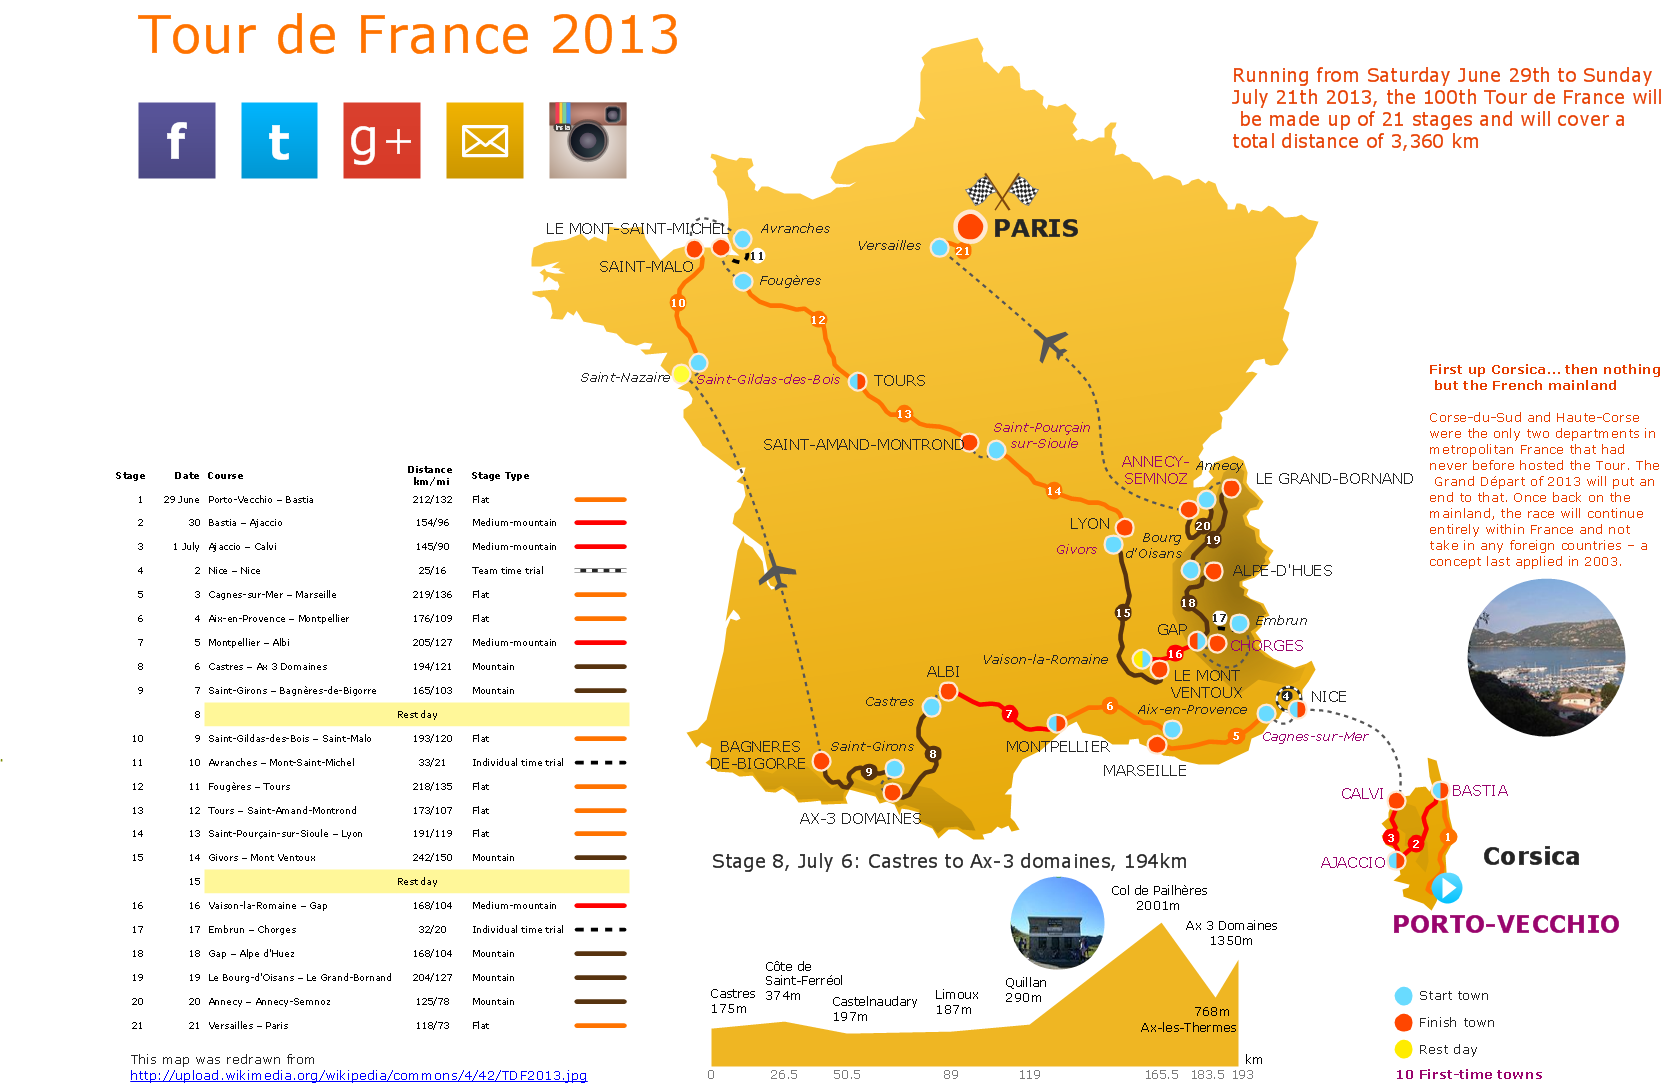
Create Spatial infographics with ConceptDraw using its excellent examples of infographic maps. We hope these can inspire and teach you!Sample Pictorial Chart. Sample Infographics
Sample Pictorial Chart - Pictorial Infographics solution provides easy-to-use design infographics drawing tools, large collection of different sample infographics and infograms, sample pictorial chart and templates to be filled in, and 10 libraries with great quantity of predesigned vector pictograms. Use Pictorial Infographics solution to draw your own design pictorial infographics documents quick and easy.HelpDesk
How to Create Education Infographics
Education Infographics is used to display a lot of education-related information in a single, visually-appealing graphic. Infographics, created for education purposes can contain different illustrations, detailed charts, and data. ConceptDraw PRO can be used as a tool for creating education infographics. It allows you to draw infographics quickly and easily using the special templates and vector stencils libraries. Infographics can be used to quickly communicate a message, to simplify the presentation of large amounts of data, to see data patterns and relationships, and to monitor changes in variables over time. It can contain bar graphs, pie charts, histograms, line charts, e.t.c.
 Spatial Infographics
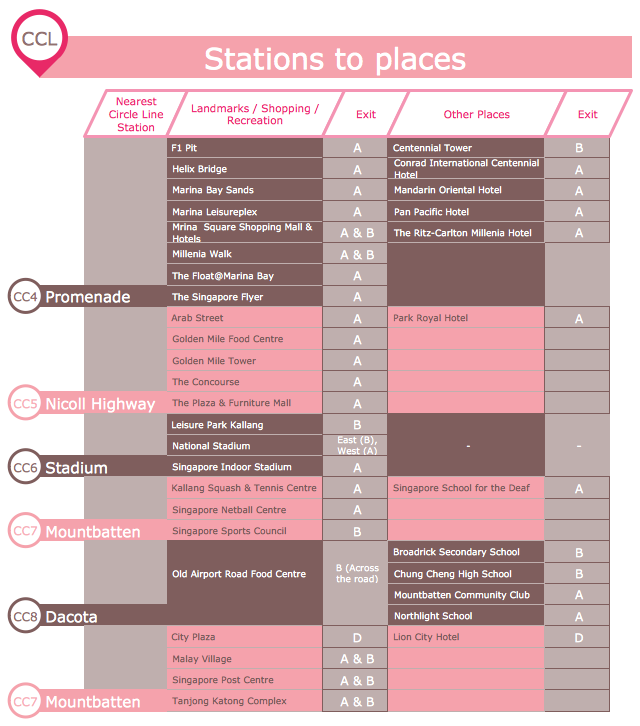
Spatial infographics solution extends ConceptDraw PRO software with infographic samples, map templates and vector stencils libraries with design elements for drawing spatial information graphics.
HelpDesk
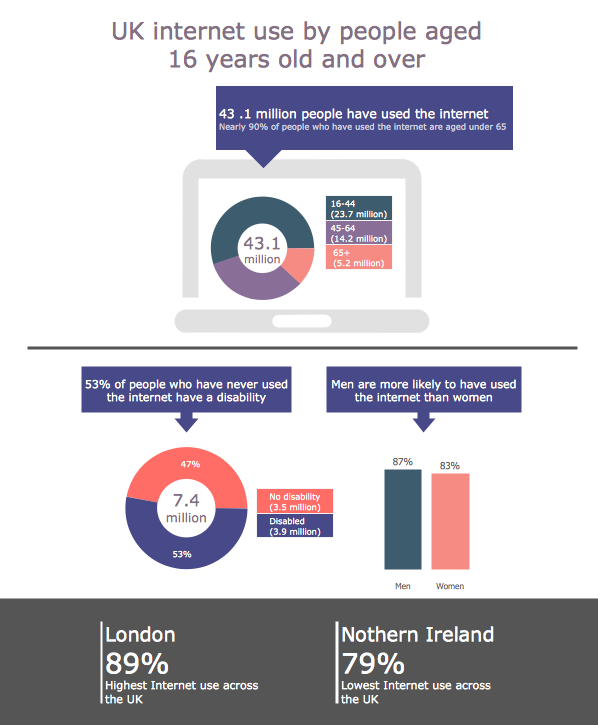
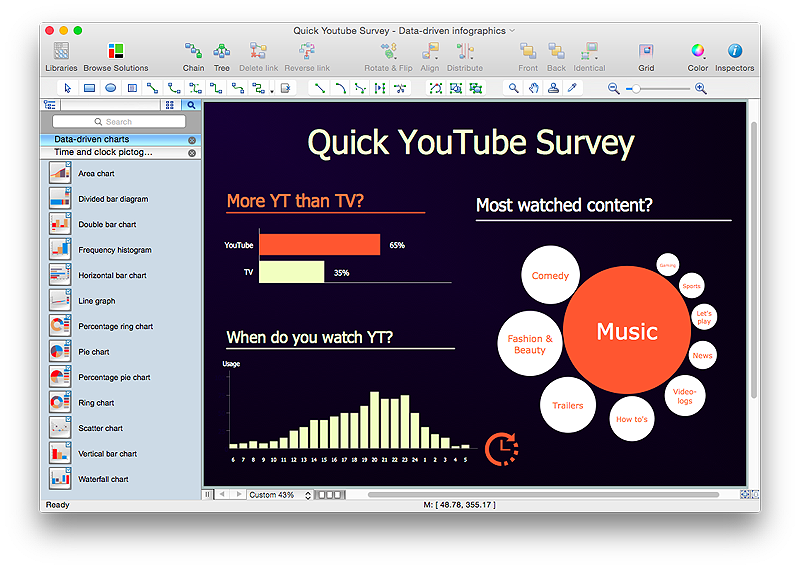
How to Create Data-driven Infographics
Data-driven infographics are used in wildly disparate areas of business and commerce. To make effective Data-driven infographics, it's useful to have a wide variety of graphical elements — icons, clipart, stencils, charts and graphs — to illustrate your diagram. ConceptDraw Data-driven Infographics solution provides all the tools you need to present data as described by this article — as well as the charts mentioned previously, you can find histograms, divided bar charts, ring charts, line graphs and area charts — meaning you can find the perfect medium for displaying a certain type of data. It allows you to draw data driven infographics quickly and easily using the special templates and vector stencils libraries.It can be used to quickly communicate a message, to simplify the presentation of large amounts of data, to see data patterns and relationships, and to monitor changes in variables over time.Content Marketing Infographics
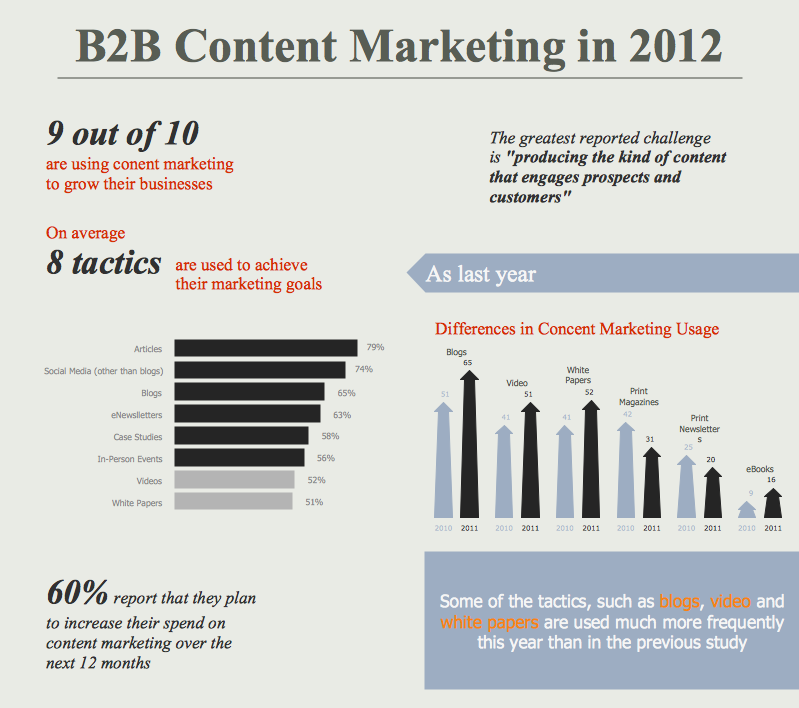
The popularity of visual content marketing grows day by day. So now simple and convenient designing of professional looking Content Marketing Infographics becomes increasingly actual. For achievement this goal ConceptDraw PRO software offers the Marketing Infographics Solution from the Business Infographics Area.How to Create an Infographic
How to Create an Infographic? It’s very easy! All what you need is a powerful infographic software. Never before creation of Infographics wasn’t so easy as now with Typography Infographics Solution from the “What are Infographics” Area for ConceptDraw Solution Park.- Spatial infographics Design Elements: Location Map | Brilliant ...
- UML Class Diagram Example for Transport System | Brilliant ...
- Superb Examples of Infographic Maps | Typography Infographic ...
- Brilliant Examples of Infographics Map, Transport, Road | Examples ...
- Brilliant Examples of Infographics Map, Transport, Road | Excellent ...
- Example Of Infographics About Technology Media Ict
- Map Directions | Brilliant Examples of Infographics Map, Transport ...
- Sample Pictorial Chart. Sample Infographics | Line Chart Examples ...
- Sample Pictorial Chart. Sample Infographics | Infographic Maker ...
- Brilliant Examples of Infographics Map, Transport, Road | Network ...
- Transportation Infographics | Spatial infographics Design Elements ...
- Brilliant Examples of Infographics Map, Transport, Road | Directional ...
- Example Of Directional Infographics
- Examples of Infographics | Typography Infographic Examples | How ...
- Road Transport - Design Elements | Brilliant Examples of ...
- Design Pictorial Infographics . Design Infographics | How to Draw a ...
- How to Create Education Infographics | Education Infographics ...
- Sample Pictorial Chart. Sample Infographics | Design elements ...
- Transportation Infographics | Intelligent transportation system | UML ...
