Examples of Infographics
ConceptDraw DIAGRAM diagramming and vector drawing software offers the unique Data-driven Infographics Solution from the “Infographics” Area with variety of predesigned examples of infographics and data-driven infographic charts.Design Pictorial Infographics. Design Infographics
In the course of recent decades data visualization went through significant development and has become an indispensable tool of journalism, business intelligence and science. The way visual information may be conveyed is not limited simply to static or dynamic representation, it can also be interactive. Infographics can be conditionally divided into several general levels. Primarily, this is level of visualization of information, its interpretation and association on any ground. Second level can be defined as a visualization of knowledge, depiction of thoughts and ideas in the form of images or diagrams. Finally, the level of data visualization, which processes data arrays in charts, enabling the information to be more clearly perceived. You can also identify the main approaches to the creation of infographics: exploratory and narrative. Exploratory method insists on minimalist design in favor of data precision without unnecessary details and is common for scientific researches and anaSample Pictorial Chart. Sample Infographics
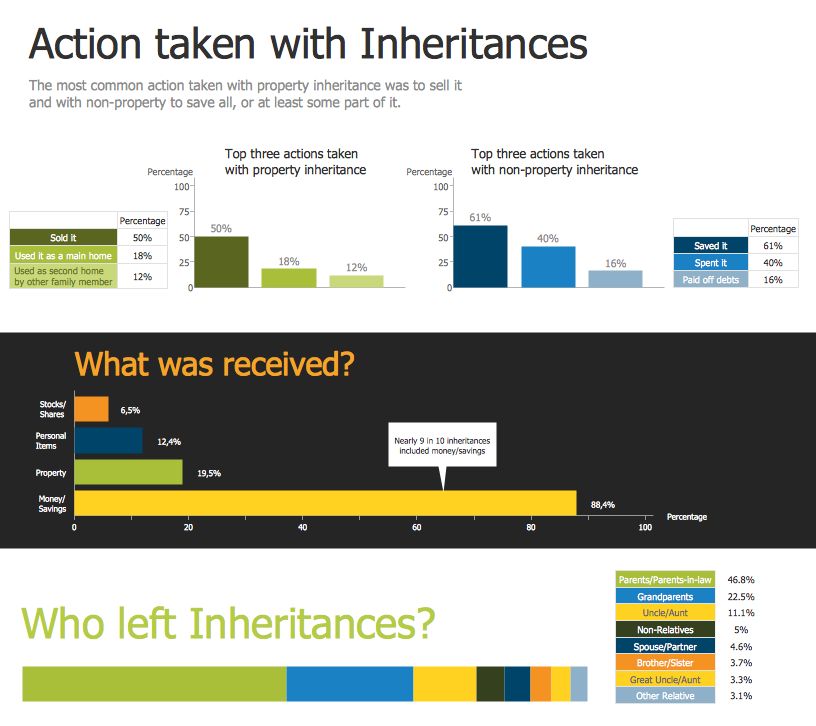
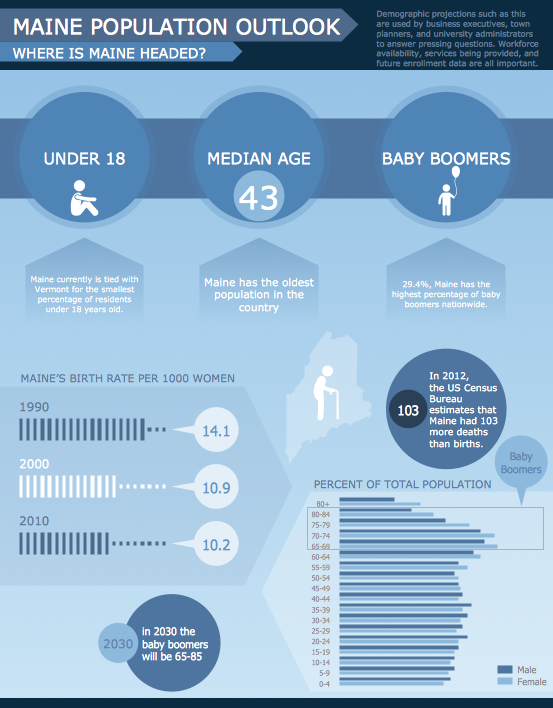
Sample Pictorial Chart - Pictorial Infographics solution provides easy-to-use design infographics drawing tools, large collection of different sample infographics and infograms, sample pictorial chart and templates to be filled in, and 10 libraries with great quantity of predesigned vector pictograms. Use Pictorial Infographics solution to draw your own design pictorial infographics documents quick and easy.
 Spatial Infographics
Tools to Create Your Own Infographics
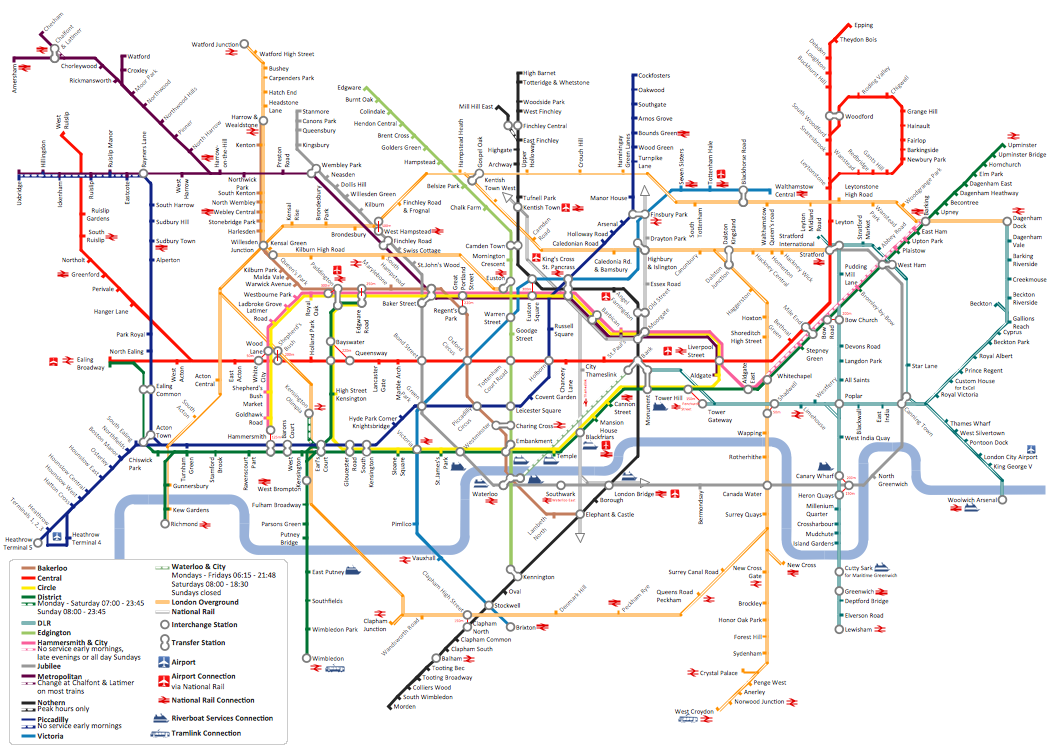
Over the past few centuries, data visualization has evolved so much that we use it every day in all areas of our lives. Many believe that infographic is an effective tool of storytelling, as well as analytics, and that it is able to overcome most of the language and educational barriers. Understanding the mechanisms of human perception will help you to understand how abstract forms and colors used in data visualization can transmit information more efficient than long paragraphs of text.How to draw Metro Map style infographics? (London)
Tool to draw Metro Map styled inforgraphics. London Tube map sample.Pictorial Chart
You want design Pictorial Chart or Infographic? And you need powerful infographic software? Then ConceptDraw DIAGRAM diagramming and vector drawing software extended with Pictorial Infographics Solution from the “Infographics” Area is exactly what you need.Marketing Plan Infographic
You need design the Marketing Plan Infographic and dream to find the useful tools to draw it easier, quickly and effectively? ConceptDraw DIAGRAM offers the unique Marketing Infographics Solution from the Business Infographics Area that will help you!Excellent Examples of Infographic Maps
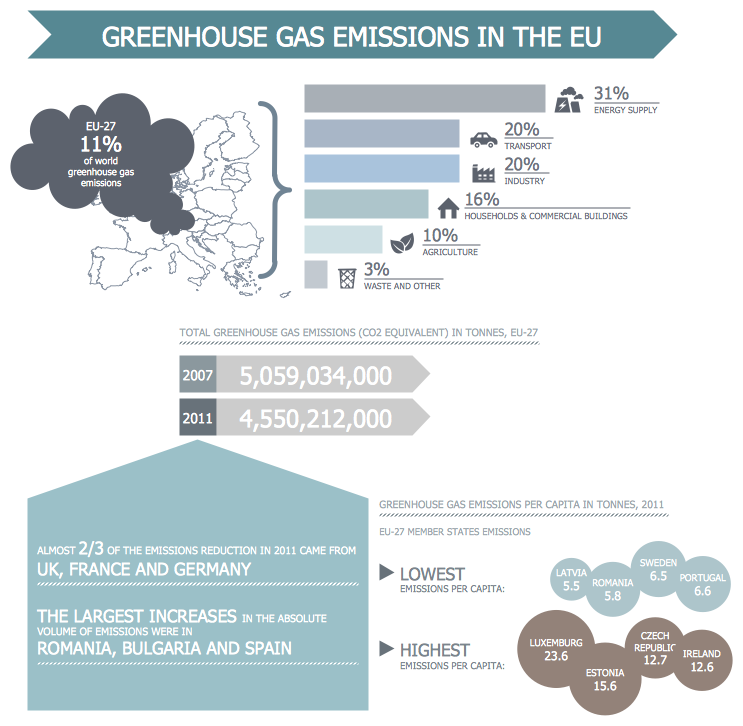
Create Spatial infographics with ConceptDraw using its excellent examples of infographic maps. We hope these can inspire and teach you!Management Tools
The science of the modern world does not stand still and is developing very fast. Day by day management specialists need the more effective and modern management tools. ConceptDraw DIAGRAM diagramming and vector drawing software provides the unique Management Infographics Solution from the Business Infographics Area with extensive management tools.Management Consultant
A management consultant is an important person for the company, he helps in the questions of improving business performance and increasing profits, he consults for the questions of business strategy, management and financial controls, resources, and also suggests recommendations for changing the structure of the company if needed.
So, every day management consultant conduct the complex work and often use the helpful management infographics for explain his thoughts and arguments to the company direction. Thanks to the development of computer technologies, drawing of management infographics is so easy today. ConceptDraw DIAGRAM diagramming and vector drawing software offers you the Management Infographics Solution from the Business Infographics Area.
Virtual private networks (VPN). Computer and Network Examples
A Virtual Private Network (VPN) is a network that allows the private networks at a remote location securely connect to the public Internet and provide access only to the intended recipients for transmitting data. VPN is built by creating the virtual point-to-point connection using the dedicated connections, traffic encryption or virtual tunneling protocols. This example was created in ConceptDraw DIAGRAM using the Computer and Networks Area of ConceptDraw Solution Park and shows the Virtual Private Network (VPN) diagram.
- Design elements - Computer pictograms | Design Pictorial ...
- Brilliant Examples of Infographics Map, Transport, Road | Metro Map ...
- Computer pictograms - Vector stencils library | Design elements ...
- Railway Computer Network Is An Example Of Which Network
- Personal area (PAN) networks. Computer and Network Examples ...
- Mac viruses timeline - Infographics | Plant Layout Plans | Marketing ...
- How to Create a Computer Network Diagram in ConceptDraw PRO ...
- Spatial Infographics | Local area network (LAN). Computer and ...
- Business Report Pie. Pie Chart Examples | Sample Pictorial Chart ...
- Railway Computer Network Is An Example Of
- How to Create Digital Media Infographics | Campus Area Networks ...
- Brilliant Examples of Infographics Map, Transport, Road ...
- Mac viruses timeline - Infographics | Ibook G4 Timeline
- Computer peripheral devices - Vector stencils library | Cisco ...
- Computers - Vector stencils library | Computer pictograms - Vector ...
- Sample Pictorial Chart. Sample Infographics | Technical Flow Chart ...
- How to Draw Pictorial Chart. How to Use Infograms | Pictorial Chart ...
- Flow Chart Symbols | Local area network (LAN). Computer and ...
- Design elements - Marketing backgrounds | Audio, Video, Media ...
- Apple machines - Vector stencils library | Technology - Vector ...


