Venn Diagram Examples for Problem Solving. Environmental Social Science. Human Sustainability Confluence
The Venn diagram example below shows sustainable development at the confluence of three constituent parts. Create your Venn diagrams for problem solving in environmental social science using the ConceptDraw PRO diagramming and vector drawing software extended with the Venn Diagrams solution from the area "What is a Diagram" of ConceptDraw Solution Park.Bar Diagrams for Problem Solving. Create economics and financial bar charts with Bar Graphs Solution
Create bar graphs for visualizing economics problem solving and financial data comparison using the ConceptDraw PRO diagramming and vector drawing software extended with the Bar Graphs Solution from the Graphs and Charts area of ConceptDraw Solition Park.Bar Diagrams for Problem Solving. Create space science bar charts with Bar Graphs Solution
Bar charts represent data in different categories or groups. Create bar graphs for visual solving your scientific problems and data comparison using the ConceptDraw PRO diagramming and vector drawing software extended with the Bar Graphs Solution from the Graphs and Charts area of ConceptDraw Solition Park.
 Quality Mind Map
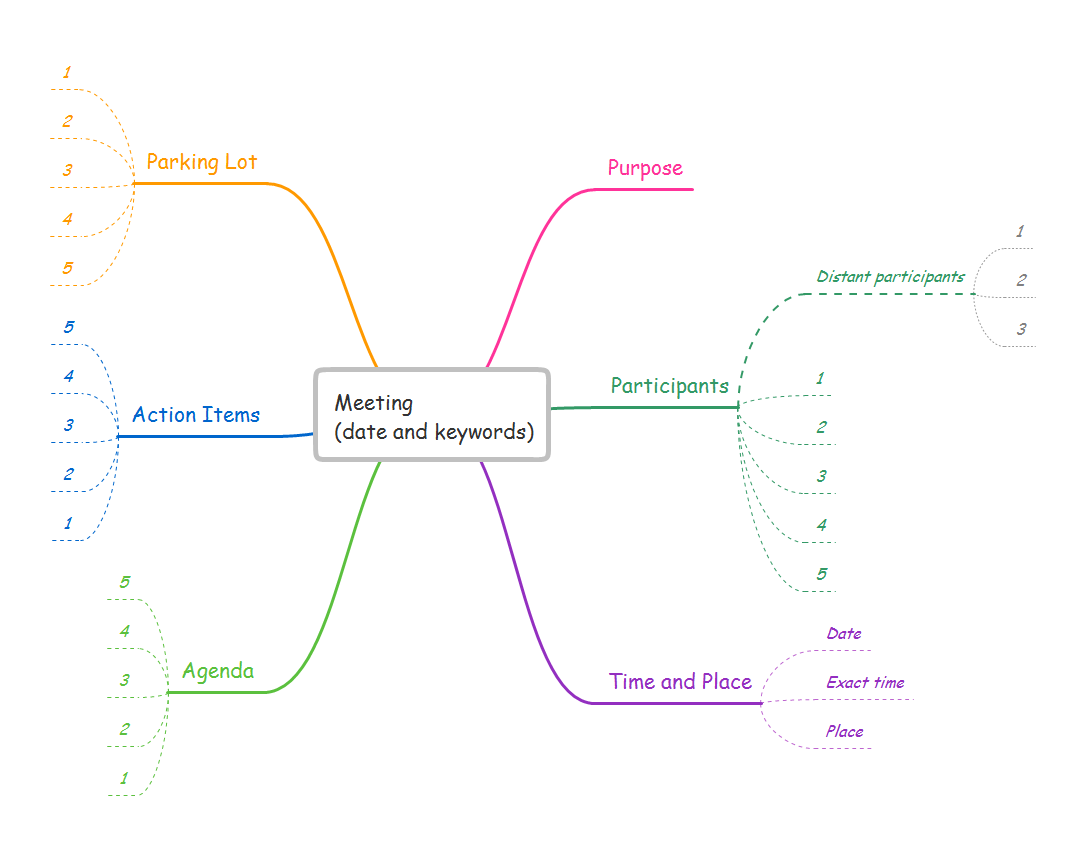
This solution extends ConceptDraw MINDMAP software with Quality Management Mind Maps (Presentations, Meeting Agendas, Problem to be solved).
Value Stream Mapping Template
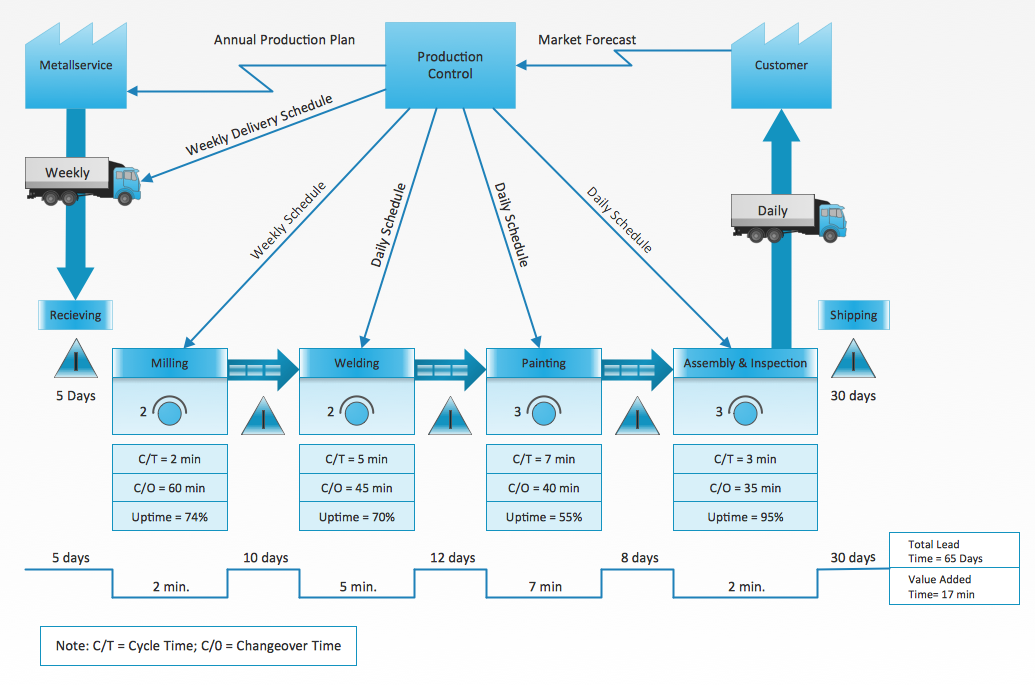
Use ConceptDraw PRO extended with Value Stream Mapping solution for document processes with professional designed Value Stream Mapping template.Venn Diagram Examples for Problem Solving. Computer Science. Chomsky Hierarchy
A Venn diagram, sometimes referred to as a set diagram, is a diagramming style used to show all the possible logical relations between a finite amount of sets. In mathematical terms, a set is a collection of distinct objects gathered together into a group, which can then itself be termed as a single object. Venn diagrams represent these objects on a page as circles or ellipses, and their placement in relation to each other describes the relationships between them. The Venn diagram example below visualizes the the class of language inclusions described by the Chomsky hierarchy.A Tool for EffectiveTeam Meetings
Use team meetings, share ideas, brainstorm ideas, team notes with ConceptDraw solution.
How To Conduct Effective Team Briefings
A team briefing tool is an excellent way to enable communication upwards, downwards and sideways throughout an organisation.
Applications
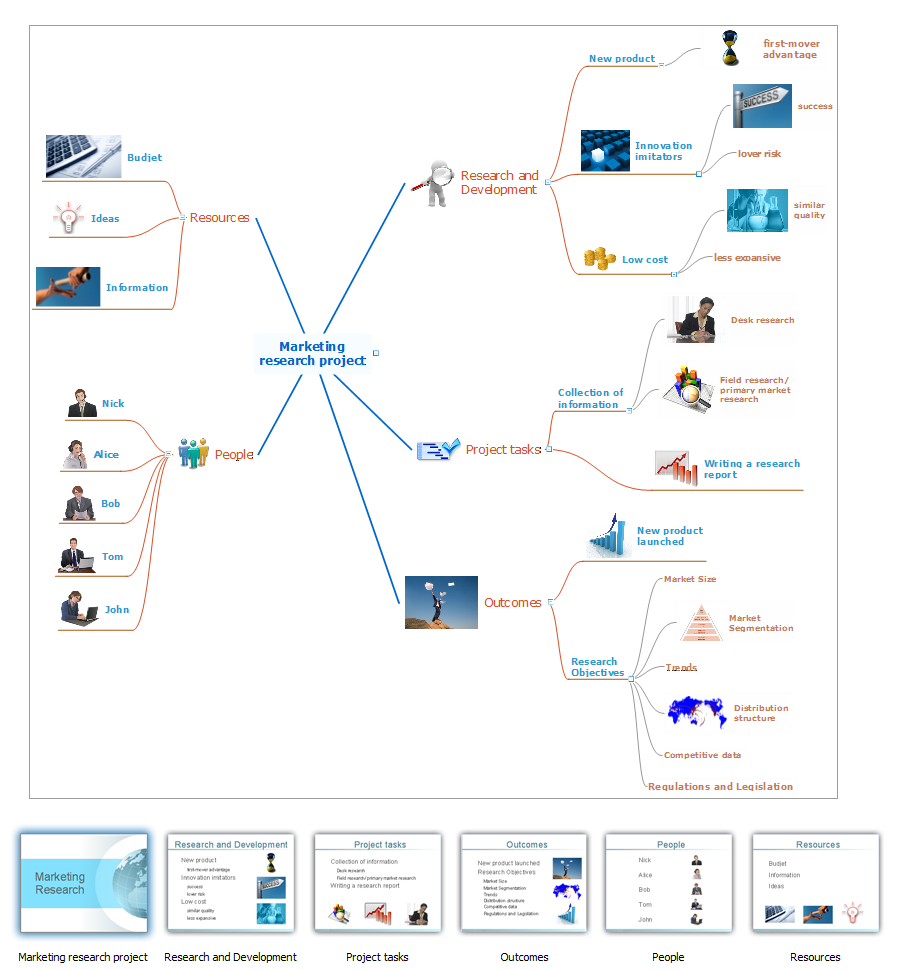
Use ConceptDraw MINDMAP for creative thinking, planning, organization, problem solving, presentations, decision making, note taking, team brainstorming and other tasks.Basic Audit Flowchart. Flowchart Examples
This sample shows the Audit Process Flowchart. It was created in ConceptDraw PRO diagramming and vector drawing software using the Flowcharts solution from the What is a Diagram area of ConceptDraw Solution Park. The Audit Flowcharts are widely used in the financial management, accounting, money management and in many others fields.Communication Tool for Remote Project Management
Communication is the main challenge and the key success factor for remote project management. Communicating visually via Skype you bring all team and customers onto the one page. Remote Presentation for Skype solution for ConceptDraw MINDMAP helps communicate with remote team and customers in visual manner on wide range of issues. Using this solution for regular status meetings allows you to push your team on tasks and keep task statuses up to date.Quality Management Teams
ConceptDraw MINDMAP with Quality mindmaps solution as a demonstration of the creative approach to quality management in daily work of quality management team.Technical Flow Chart Example
What illustrates a technical flow chart? Technical flow chart is a diagrammatic representation which visually illustrates the sequence of operations that must to be performed to get the problem's solution. ConceptDraw PRO enhanced with Flowcharts Solution from the "What is a Diagram" Area of ConceptDraw Solution is a perfect software for drawing Technical Flow Chart Example illustrating the essence and importance of the technical flow chart use.Venn Diagram Examples for Problem Solving. Venn Diagram as a Truth Table
Venn diagrams are illustrations used in the branch of mathematics known as set theory. They show the mathematical or logical relationship between different groups of things (sets). A Venn diagram shows all the possible logical relations between the sets.Value Stream Mapping Examples
ConceptDraw PRO diagramming and vector drawing software supplied with Value Stream Mapping solution from the Quality area of ConceptDraw Solution Park is ideal for drawing Value Stream Maps and includes variety of value stream mapping examples.- Problem Solution Map Examples
- Example Of Problem Solution Map
- Quality Mind Map | TQM Diagram Example | Fishbone Diagram ...
- Quality Problems Examples
- Venn Diagram Examples for Problem Solving. Environmental Social ...
- Problem Solution Sample Templates
- Chart Showing The Problem And Solution In Engineering
- Problem Solution Engineering
- Venn Diagram Examples for Problem Solving. Environmental Social ...
- Venn Diagram Examples for Problem Solving. Environmental Social ...
- Social Media Response | Venn Diagram Examples for Problem ...
- Venn Diagram Examples for Problem Solving. Computer Science ...
- Map Or Drawing And Diagram Of Environment
- The Best Choice for Creating Diagram | Concept Mapping ...
- Mind Map Science Solutions
- Flowchart Definition | Venn Diagram Examples for Problem Solving ...
- Example Of Problem And Solution
- How To Create Root Cause Analysis Diagram Using ConceptDraw ...
- Examples Of Fishbone Map
- Sample Mind Map In Science


