 Manufacturing and Maintenance
Manufacturing and maintenance solution extends ConceptDraw DIAGRAM software with illustration samples, templates and vector stencils libraries with clip art of packaging systems, industrial vehicles, tools, resources and energy.
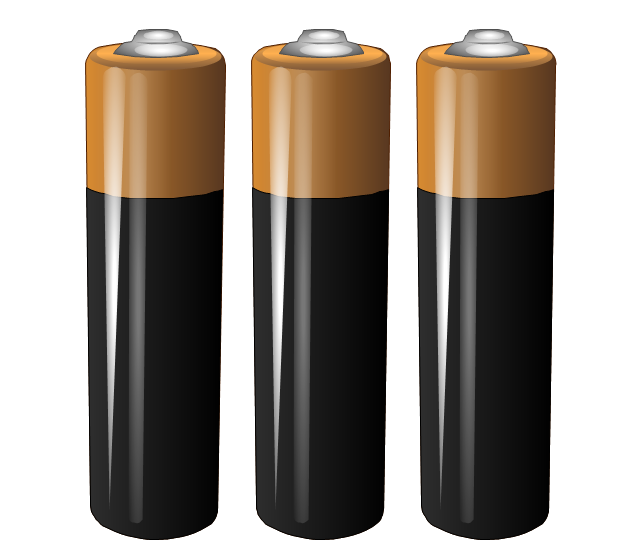
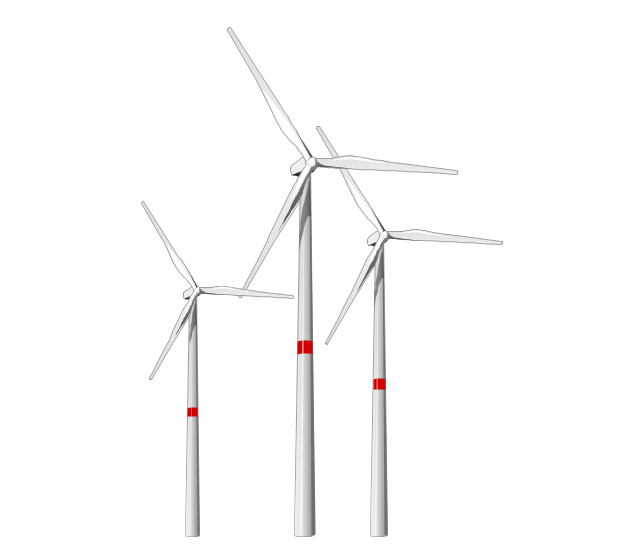
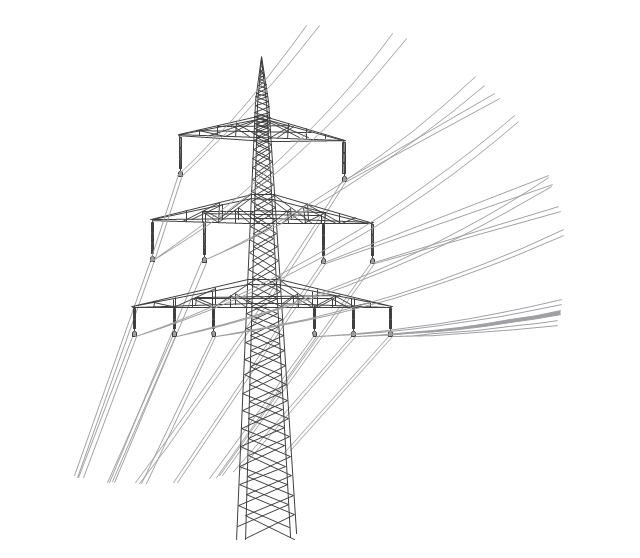
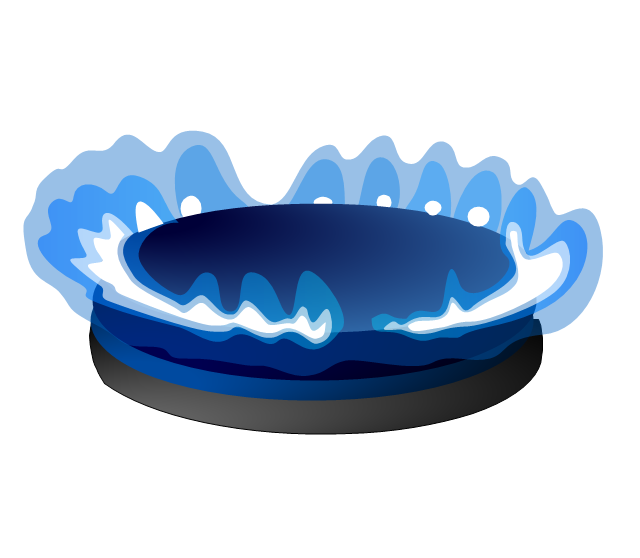
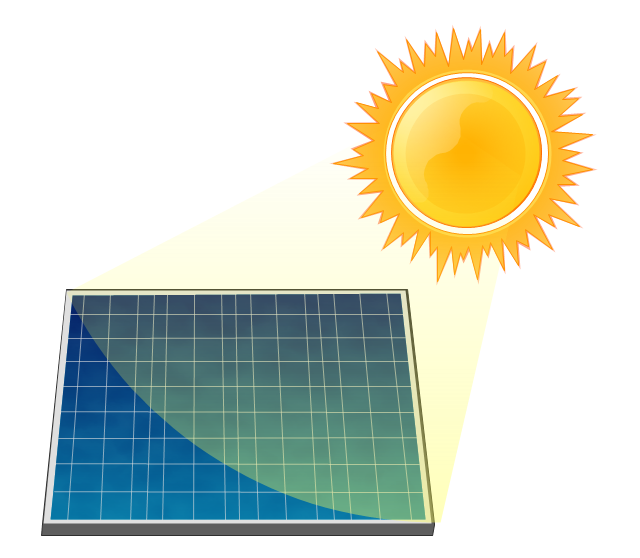
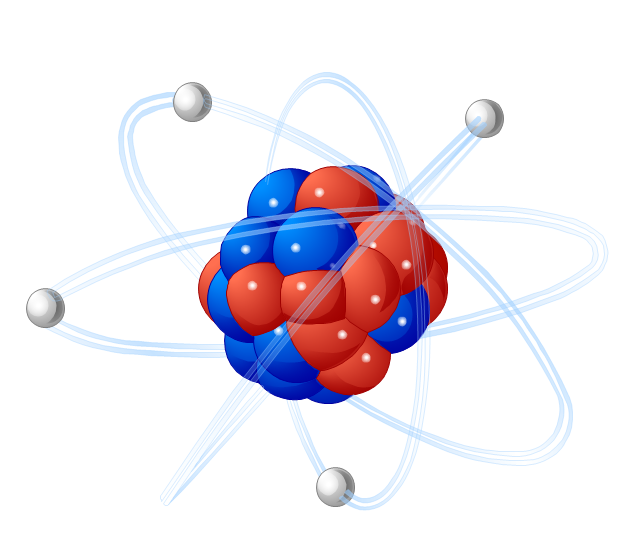
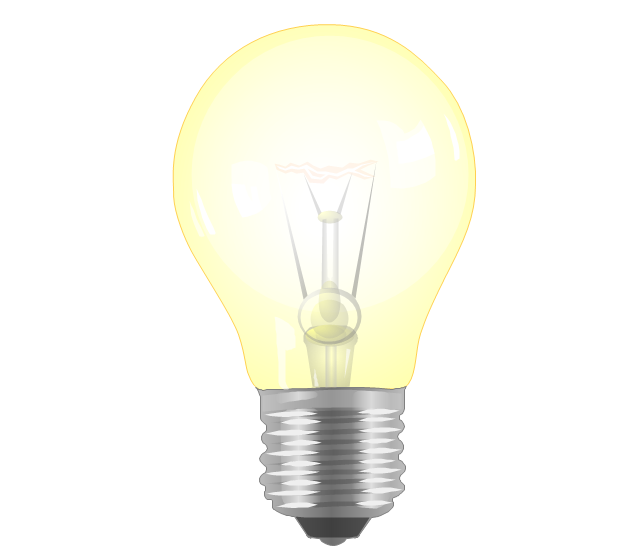
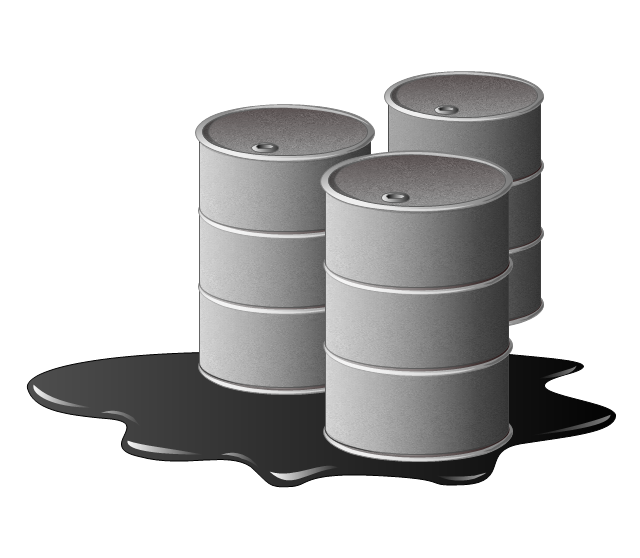
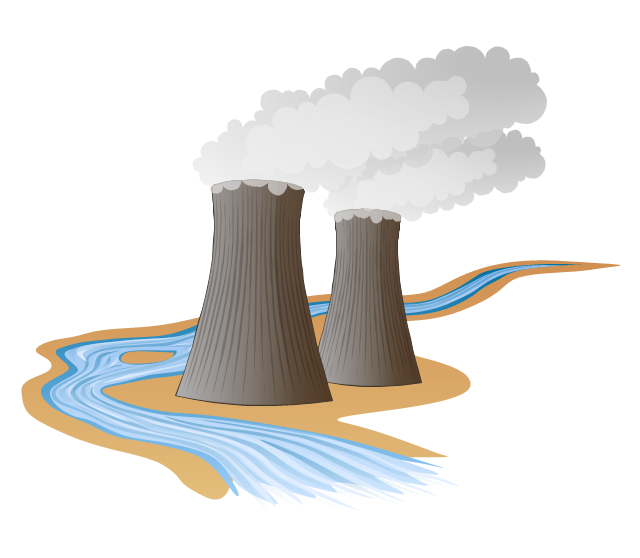
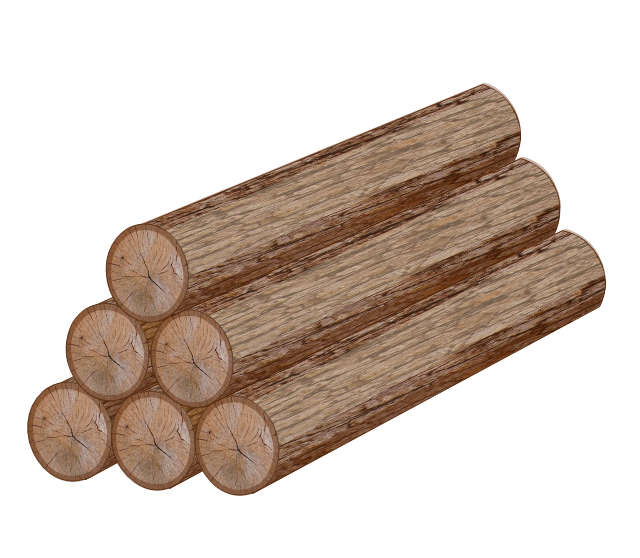
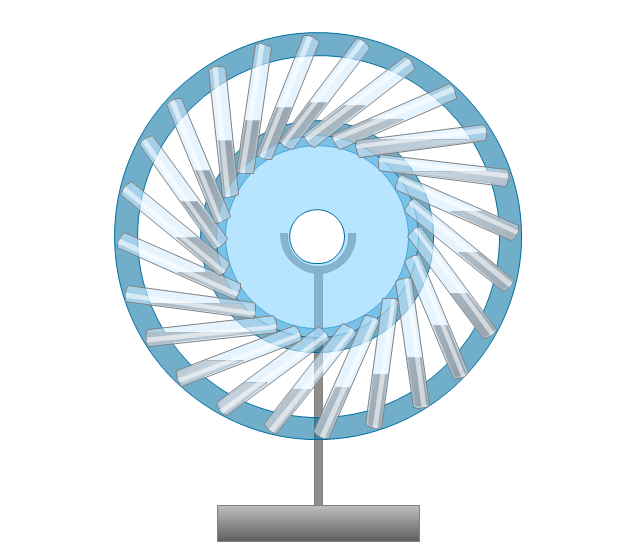
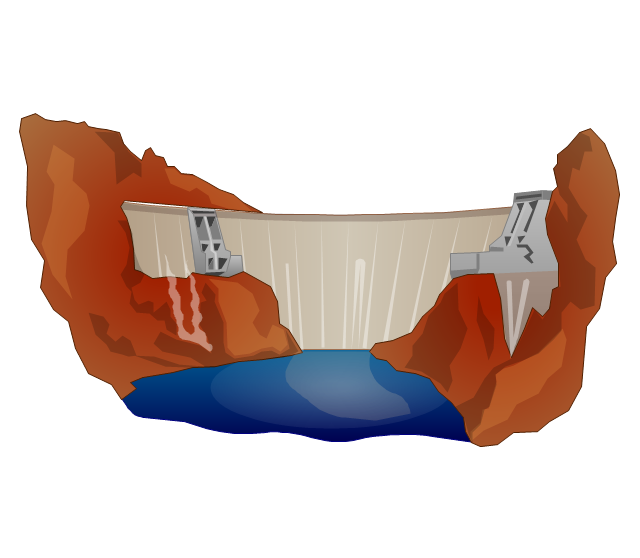
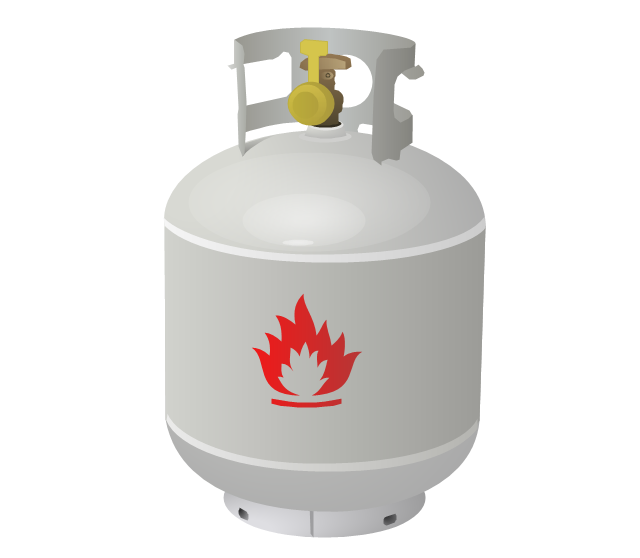
The vector stencils library "Resources and energy" contains 19 clipart images for drawing illustrations on resources and energy.
"Natural resources occur naturally within environments that exist relatively undisturbed by humanity, in a natural form. A natural resource is often characterized by amounts of biodiversity and geodiversity existent in various ecosystems.
Natural resources are derived from the environment. Some of them are essential for our survival while most are used for satisfying our wants. Natural resources may be further classified in different ways.
Natural resources are materials and components (something that can be used) that can be found within the environment. Every man-made product is composed of natural resources (at its fundamental level). A natural resource may exist as a separate entity such as fresh water, and air, as well as a living organism such as a fish, or it may exist in an alternate form which must be processed to obtain the resource such as metal ores, oil, and most forms of energy." [Natural resource. Wikipedia]
The clip art example "Resources and energy - Vector stencils library" was created in ConceptDraw PRO diagramming and vector drawing software using the Manufacturing and Maintenance solution from the Illustration area of ConceptDraw Solution Park.
 Cross-Functional Flowcharts
The Cross-Functional Flowcharts solution extends ConceptDraw DIAGRAM software with cross functional flowchart examples, samples, and libraries of cross functional flow chart vector design elements and CH-1 symbols for easy drawing professional-looking and illustrative Cross Functional Flowchart, Cross Functional Diagram, CH-1 Diagram, Process Flowchart, Deployment Flowchart, Opportunity Flowchart, Swimlane Process Mapping Diagram, or Visio Cross Functional Flowchart for planning and further analyzing, optimizing and improvement processes. The use of included pre-made cross functional flowchart template, opportunity flowchart template, and swimlane process map template, greatly easier designing your Cross-functional flowcharts.
 Sales Flowcharts
The Sales Flowcharts solution lets you create and display sales process maps, sales process workflows, sales steps, the sales process, and anything else involving sales process management.
Circular Diagram
Circular Diagram is a type of diagram widely used in marketing and economics for visualization information in a clear and visual form. ConceptDraw DIAGRAM diagramming and vector drawing software offers the useful tools of the Target and Circular Diagrams solution from the Marketing area of ConceptDraw Solution Park for effective drawing a Circular Diagram of any complexity and design.
 Pie Charts
Pie Charts are extensively used in statistics and business for explaining data and work results, in mass media for comparison (i.e. to visualize the percentage for the parts of one total), and in many other fields. The Pie Charts solution for ConceptDraw DIAGRAM offers powerful drawing tools, varied templates, samples, and a library of vector stencils for simple construction and design of Pie Charts, Donut Chart, and Pie Graph Worksheets.
 Seven Basic Tools of Quality
Seven Basic Tools of Quality solution is useful for all ConceptDraw DIAGRAM users, giving them a particular set of different graphical techniques helping on focus on such activity as identifying the root cause of many quality-related issues. This solution offers the well-known visual tools helpful in representing all the data related to different quality initiatives. Some of such tools are the pre-made templates useful for making different fishbone diagrams, Pareto charts, and histograms. It is ideal for all who want to manage quality control throughout an organization by using a modern tool.
Example Process Flow
A flowchart is a picture of the separate steps of a process in sequential order. ConceptDraw DIAGRAM is a Process Flowcharts software. This software includes basic package of process flow examples. The software contains object libraries with vector stencils that allows you use RapidDraw technology. By clicking on direction arrows you can add a new object to the flowchart.Pyramid Chart Examples
Pyramid Charts and Triangle Diagrams are used to visually structure the topics and progressively order the quantitative data. They allow to illustrate hierarchical structure of the topics, proportional, interconnected and containment relations among the topics. The multilevel Pyramids and Triangle diagrams are constructed oriented up or down and divided into several horizontal slices. They are effectively used to represent marketing strategies, social strategies, information systems, market value, etc., to illustrate presentations, websites, documents, reports in business, finances, sales, management, marketing, media, training, consulting, and many other fields. To maximize the efficiency in drawing the Pyramid Charts, use the ConceptDraw DIAGRAM diagramming and vector drawing software extended with Pyramid Diagrams solution from Marketing area, which contains the set of Pyramid Chart examples, samples, templates and vector design elements of triangular diagrams and pyramids with different quantity of levels for various needs.Types of Flowcharts
A Flowchart is a graphical representation of process, algorithm, workflow or step-by-step solution of the problem. It shows the steps as boxes of various kinds and connects them by arrows in a defined order depicting a flow. There are twelve main Flowchart types: Basic Flowchart, Business Process Modeling Diagram (BPMN), Cross Functional Flowchart, Data Flow Diagram (DFD), IDEF (Integrated DEFinition) Flowchart, Event-driven Process Chain (EPC) Diagram, Influence Diagram (ID), Swimlane Flowchart, Process Flow Diagram (PFD), Specification and Description Language (SDL) Diagram, Value Stream Mapping, Workflow Diagram. Using the Flowcharts solution from the Diagrams area of ConceptDraw Solution Park you can easy and quickly design a Flowchart of any of these types. This solution offers a lot of special predesigned vector symbols for each of these widely used notations. They will make the drawing process of Flowcharts much easier than ever. Pay also attention for the included collection of ready Flowchart examples, samples and quick-start templates. This is business process improvement tools. If you are looking for MS Visio for your Mac, then you are out of luck, because it hasn't been released yet. However, you can use Visio alternatives that can successfully replace its functions. ConceptDraw DIAGRAM is an alternative to MS Visio for Mac that provides powerful features and intuitive user interface for the same.
Examples of Flowchart Diagram
ConceptDraw - feature-rich flowchart software. This software includes flowchart diagram examples set. Libraries contain vector stencils that allow users to use RapidDraw technology. Users can start draw their own flowchart diagrams from existing examples by clicking on direction arrows.Security Plans
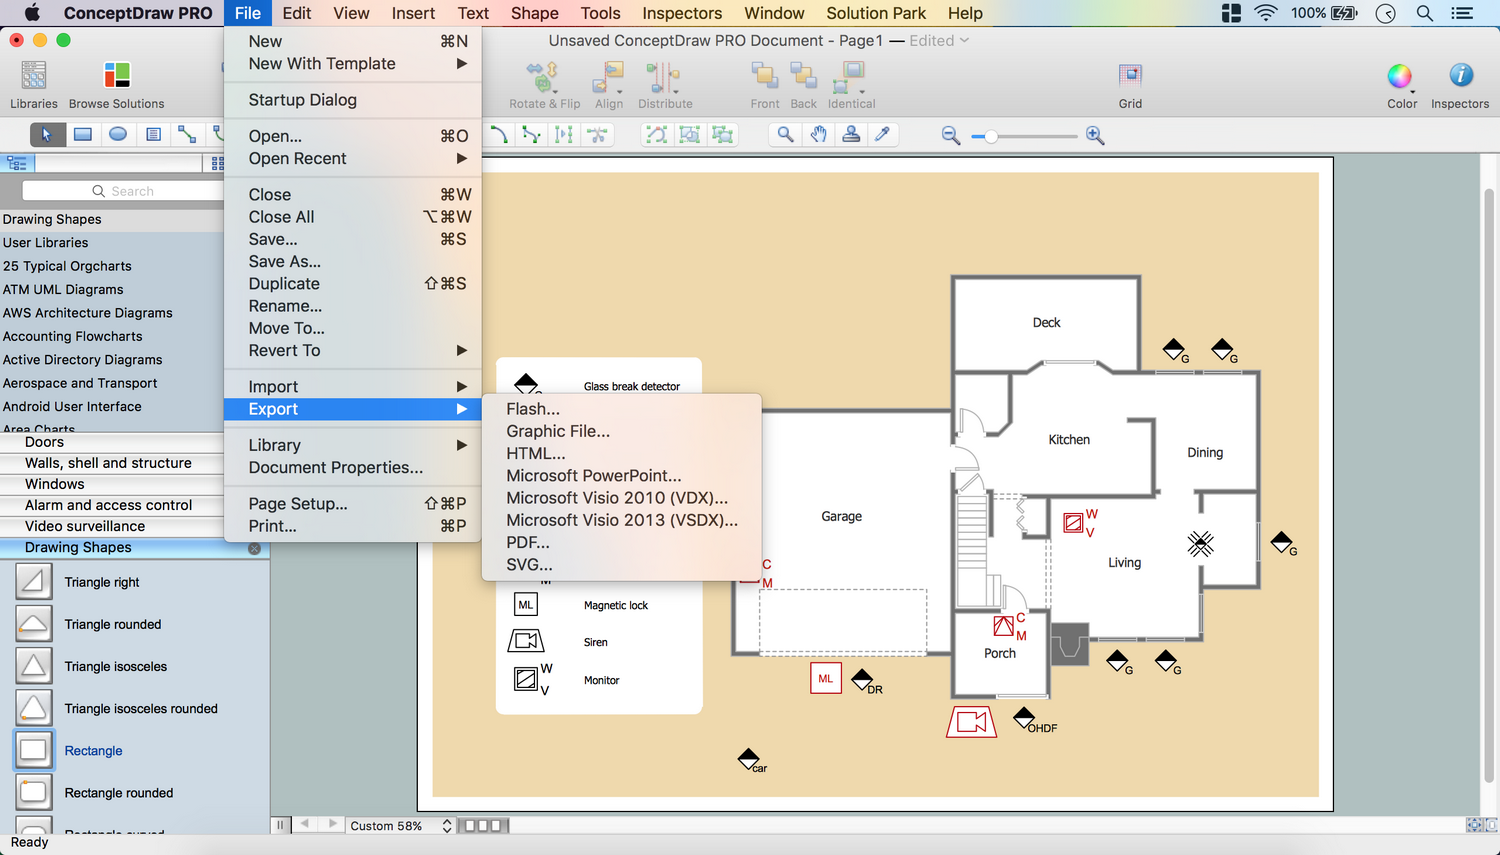
No security system cannot be constructed without detailed security plan, or even a set of plans in some cases. ConceptDraw DIAGRAM software offers the Security and Access Plans Solution from the Building Plans Area to help you design the Security Plans for any premises and of any complexity.Flowchart on Bank. Flowchart Examples
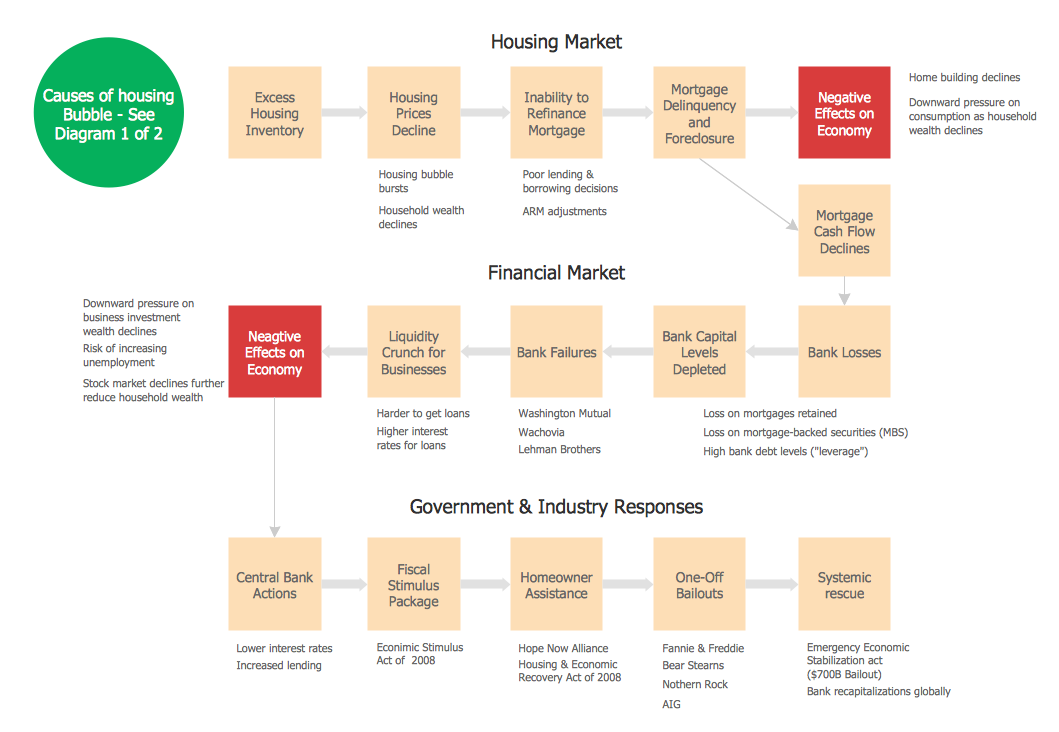
This sample was created in ConceptDraw DIAGRAM diagramming and vector drawing software using the Flowcharts solution from the Diagrams area of ConceptDraw Solution Park. This sample shows the Flowchart of the Subprime Mortgage Crisis. This Flowchart describes the decline in housing prices when the housing bubble burst and what it caused on the housing and financial markets. You can also see the Government and Industry responses in this crisis situation.
Flow Chart in Chemistry
Flow charts are widely used in chemistry and simplify the understanding of the chemical processes, basic structure of a system, its components, and interactions, materials flow throughout a process. ConceptDraw DIAGRAM software extended with Chemical and Process Engineering solution is the easiest for using a multifunctional diagramming tool, which helps to create a Flow Chart in chemistry, Chemistry diagrams of any type, and Chemistry flow diagrams with ease. Illustrate any chemical processes in minutes.Geo Map — USA — Illinois
Illinois is a state in the Midwestern United States. It is the 5th most populous and 25th most extensive state, and is often noted as a microcosm of the entire country. The vector stencils library Illinois contains contours for ConceptDraw DIAGRAM diagramming and vector drawing software. This library is contained in the Continent Maps solution from Maps area of ConceptDraw Solution Park.Basic Diagramming Flowchart Software
ConceptDraw DIAGRAM is a powerful intelligent vector graphics tool for drawing flowcharts.
 Mathematics
Mathematics is simply essential in many fields, such as natural science, medicine, finance, the social sciences, and engineering. Mathematicians often face the need for creating the mathematical drawings in order to explain different theories and equations. In order to make such illustrations, the ConceptDraw DIAGRAM diagramming and drawing software may be used. The Mathematics solution can be used while working in the ConceptDraw DIAGRAM application using its pre-made samples, templates, and vector shape libraries of both solid and plane geometric figures, trigonometrical functions and mathematical symbols. It may help many mathematicians to create numeral mathematical diagrams, mathematic illustrations and tape diagrams for either scientific or educational, or both purposes.
An Event-driven Process Chain (EPC) - flowchart used for business process modelling
Event-Driven Process Chain flowcharts for improvement throughout an organisation. ConceptDraw DIAGRAM is a business process mapping software for making EPC flowcharts to provide business process modelling. Its excellent business process improvement tools.Flow Map
A Flow Map is a type of thinking maps which help easy organize and understand information. It consists of the set of boxes and arrows, and visually displays a sequence of events. ConceptDraw DIAGRAM diagramming and vector drawing software extended with Flowcharts Solution from the "Diagrams" Area of ConceptDraw Solution Park allows you to draw in a few minutes the Flow Map of any degree of complexity.- Manufacturing and Maintenance | Pie Charts | 25 Typical Orgcharts ...
- Resources and energy | UK Map | Example Of Natural Resources
- Energy resources diagram | Non Renewable Resources Diagram
- Resources and energy - Vector stencils library | Example Of Natural ...
- Resources and energy - Vector stencils library | HR Flowcharts ...
- Resources and energy - Vector stencils library | Design elements ...
- Resources and energy | UK Map | Examples Of Natural Resources
- Flow chart Example . Warehouse Flowchart | Resources and energy ...
- Resources and energy | Examples Of Manmade Resources
- Resources and energy - Vector stencils library | Human Resource ...

