This site uses cookies. By continuing to browse the ConceptDraw site you are agreeing to our Use of Site Cookies.

Data Flow Diagram Symbols. DFD Library

Data Flow Diagrams show information transfers and process steps of a system. The general concept is an approach of a depicting how occurs input in a system, further processes and what runs out. The aim of DFD is in accomplishing of understanding between developers and users. Data flow diagrams are maintained with other methods of structured systems analysis.

Accounting Flowchart Symbols

If you deal everyday with accounting procedures, you might come to that point when you have to draw an accounting flowchart mentioning all the necessary details for getting the right result and in order to succeed in your field of business activity. Making it is truly simple in case you have ConceptDraw DIAGRAM which is a unique software that allows you to create any kinds of charts and flowcharts as well as schemes, diagrams and plans. This product is so special that once you start using it, you will understand the way it works quick and will never need any other software for the purpose of creating all mentioned above to see as a result incredible, smart, professional, sophisticated flowchart.

Basic Flowchart Symbols and Meaning

Flowchart Symbols and Meaning - Provides a visual representation of basic flowchart symbols and their proposed use in professional workflow diagram, standard process flow diagram and communicating the structure of a well-developed web site, as well as their correlation in developing on-line instructional projects. See flowchart's symbols by specifics of process flow diagram symbols and workflow diagram symbols.
How to Build a Flowchart

Entity Relationship Diagram Symbols

Creating an entity-relationship (ER) model is to visually represent the structure of a business database, where data equates to entities (or objects) that are linked by defined relationships expressing dependencies and requirements. By nature it is an abstract visualization, the first step in the design process towards creating a logical and functional database.
ERD symbols used for professional ERD drawing are collected in libraries from the Entity-Relationship Diagram (ERD) solution for ConceptDraw DIAGRAM.

Data Flow Diagram Examples

You need to draw the Data Flow Diagram? Use ConceptDraw DIAGRAM diagramming and vector drawing software extended with Data Flow Diagrams solution from the Software Development area of ConceptDraw Solution Park.The Data Flow Diagrams solution provides a numerous collection of Data Flow Diagram examples created according to Gane and Sarson, and Yourdon and Coad notations using the ConceptDraw DIAGRAM software.

Gane Sarson Diagram

The vector stencils library Gane-Sarson Notation from the solution Data Flow Diagrams contains specific symbols of the Gane-Sarson notation such as process symbol, connector symbol, jump symbol for ConceptDraw DIAGRAM diagramming and vector drawing software. The Data Flow Diagrams solution is contained in the Software Development area of ConceptDraw Solution Park.

Flow Chart Symbols

ConceptDraw DIAGRAM software extended with Flowcharts Solution from the "Diagrams" Area is a powerful software that will help you design the flowcharts for any business and technical processes, and software algorithms thanks to the predesigned flow chart symbols. Flowcharts solution offers 2 libraries with large collection of vector flow chart symbols: Flowchart Library, Flowcharts Rapid Draw Library that you can use to create your flowcharts quick and easy. Flowchart Solution is number of diagraming stencils including special set of flow chart symbols such as: terminator, process, decision which indicates a decision points between two or more paths in a flowchart, symbol of delay. Major symbols includes symbol of data, document or multiple documents, subroutine, preparation for processing of documents. Also includes symbols: display, manual input, manual loop, loop limit, stored data,connectors and suming junctions, sort and merge operations, symbols of database and internal stor

Data structure diagram with ConceptDraw DIAGRAM

Data structure diagram (DSD) is intended for description of conceptual models of data (concepts and connections between them) in the graphic format for more obviousness. Data structure diagram includes entities description, connections between them and obligatory conditions and requirements which connect them. Create Data structure diagram with ConceptDraw DIAGRAM.

ERD Symbols and Meanings

Crow's foot notation is used in Barker's Notation, Structured Systems Analysis and Design Method (SSADM) and information engineering. Crow's foot diagrams represent entities as boxes, and relationships as lines between the boxes. Different shapes at the ends of these lines represent the cardinality of the relationship.
The Chen's ERD notation is still used and is considered to present a more detailed way of representing entities and relationships.
To create an ERD, software engineers mainly turn to dedicated drawing software, which contain the full notation resources for their specific database design - ERD symbols and meanings. CS Odessa has released an all-inclusive Entity-Relationship Diagram (ERD) solution for their powerful drawing program, ConceptDraw DIAGRAM.
How to Build an Entity Relationship Diagram (ERD)

Database Flowchart Symbols

Data base diagrams describes inter-related data and tables. It describes roles and relationships, internal and external dependencies, data exchange conventions and structures of knowledge domain.
ConceptDraw Software provides number of data-base chart libraries including major 49 vector symbols. Use these DFD flowchart symbol libraries to design data-base structure and models, use it to design data base process-oriented models, or simple data-oriented models. The are special drawing tools for making data flowcharts, data process diagrams, structured analysis diagrams, and information flow diagrams.

Accounting Data Flow from the Accounting Flowcharts Solution

Accounting Data Flow from the Accounting Flowcharts Solution visually describes the financial accounting process, shows the accumulated information about transactions and events for creating the balance sheet and the final income statement.
Accounting Flowcharts Solution contains also a wide variety of templates and samples that you can use as the base for your own Accounting Flowcharts of any complexity.

IDEF0 Flowchart Symbols

The IDEF0 method is built on the functional modeling language Structured Analysis and Design Technique (SADT) and focuses on activity modeling. The ability to create the IDEF0 flowcharts and business diagrams rapidly and without efforts is made possible thanks to wide range of intuitive tools of ConceptDraw DIAGRAM software and IDFE0 notation supplied by IDEF0 Diagrams solution from the Software Development area. This solution is rich for the ready-to-use specific IDEF0 flowchart symbols grouped in IDEF0 Diagram library.

Cross Functional Flowchart Symbols

The excellent possibility to create attractive Cross Functional Flowcharts for step-by-step visualization the operations of a business process flow of any degree of detailing is offered by ConceptDraw’s Cross-Functional Flowcharts solution. The extensive selection of commonly used vector cross functional flowchart symbols allow you to demonstrate the document flow in organization, to represent each team member’s responsibilities and how processes get shared or transferred between different teams and departments.

Business Process Flowchart Symbols

The business process flowchart symbols used for business process mapping are predefined by Business Process Modeling Notation (BPMN) and actually have their roots in the data processing diagrams and programming flow charts. Business Process flowchart symbols provide drawing business process flowcharts, diagrams and maps of any complexity.

DFD Flowchart Symbols

A Data Flow Diagram (DFD) is a graphical technique which allows effectively model and analyze the information processes and systems. The ability to fast and easy create the DFDs is made possible with Data Flow Diagrams solution from the Software Development area of ConceptDraw Solution Park. For designing the Data Flow Diagrams are used simple DFD flowchart symbols which are connected each other by arrows depicting the data flow from one step to another.

Example of DFD for Online Store (Data Flow Diagram)

Data flow diagrams (DFDs) reveal relationships among and between the various components in a program or system. DFDs are an important technique for modeling a system’s high-level detail by showing how input data is transformed to output results through a sequence of functional transformations.
Example of DFD for Online Store shows the Data Flow Diagram for online store and interactions between the Visitors, Customers and Sellers, as well as Website Information and User databases.
Steps to Creating a Sales Process Flow Chart

Swim Lane Flowchart Symbols

Use the set of special professionally developed swim lane flowchart symbols - single, multiple, vertical and horizontal lanes from the Swimlanes and Swimlanes BPMN 1.2 libraries from the Business Process Diagram solution, the Swim Lanes library from the Business Process Mapping solution as the perfect basis for your Swim Lane Flowcharts of processes, algorithms and procedures.

Data Flow Diagram

Data flow diagram (DFD) is the part of the SSADM method (Structured Systems Analysis and Design Methodology), intended for analysis and information systems projection. Data flow diagrams are intended for graphical representation of data flows in the information system and for analysis of data processing during the structural projection. Data flow diagram often used in connection with human process and can be displayed as workflow diagram. The critical Process Flow Diagram is another flowchart technique for designing data flow in connection with organizational processes. The critical Process flow diagram may use different range of symbols than a classic workflow diagram.
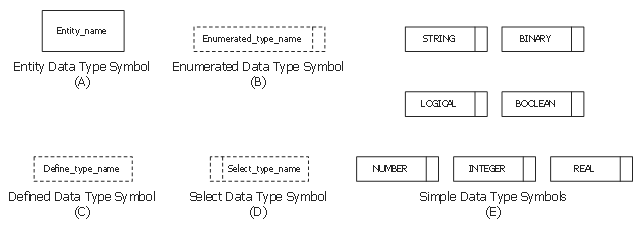
This sample shows the EXPRESS-G notation data type symbols.
This example was drawn on the base of the Wikimedia Commons file: A 02A Data type symbols.svg. [commons.wikimedia.org/ wiki/ File:A_ 02A_ Data_ type_ symbols.svg]
This file is made available under the Creative Commons CC0 1.0 Universal Public Domain Dedication. [creativecommons.org/ publicdomain/ zero/ 1.0/ deed.en]
"EXPRESS offers a series of datatypes, with specific data type symbols of the EXPRESS-G notation:
* Entity data type...
* Enumeration data type...
* Defined data type...
* Select data type...
* Simple data type
* String...
* Binary...
* Logical...
* Boolean...
* Number...
* Integer...
* Real...
* Aggregation data type" [EXPRESS (data modeling language). Wikipedia]
The EXPRESS-G notation example "EXPRESS-G data type symbols" was designed using ConceptDraw PRO software extended with EXPRESS-G solution from the Software Development
area of ConceptDraw Solution Park.
Data modeling
Data modeling, select type, Express-G notation, enumerated type, Express-G notation, entity, Express-G notation, defined type, Express-G notation, base types, Express-G notation,

Account Flowchart Stockbridge System. Flowchart Examples

Create your own flow charts of data processing systems using the ConceptDraw DIAGRAM diagramming and vector drawing software extended with the Cross-Functional Flowcharts solution from the Business Processes area of ConceptDraw Solution Park.
This is a flowchart of a data processing system combining manual and computerized processing to handle accounts receivable, billing, and general ledger.