 Seven Management and Planning Tools
Seven Management and Planning Tools solution extends ConceptDraw PRO and ConceptDraw MINDMAP with features, templates, samples and libraries of vector stencils for drawing management mind maps and diagrams.
HelpDesk
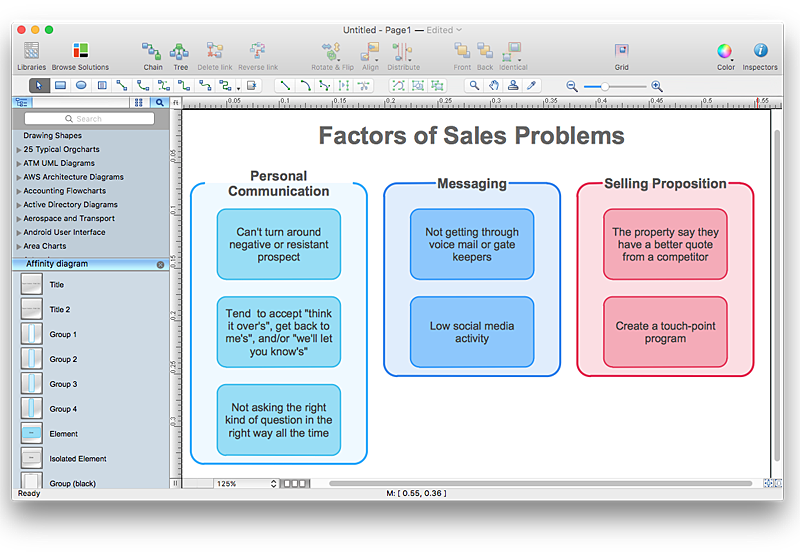
How To Create an Affinity Diagram Using ConceptDraw Office
Affinity diagram is designed to prepare the data for further analysis of the cause-effect relationships.The Affinity diagram shows the structure of large, complex factors that have an influence on a problem, and then divides them up into a smaller and simpler structure. We recommend using a mind map for Brainstorming and collecting the factors affecting the problem. The ability to create an Affinity diagram from a mind map is supported by the ConceptDraw Seven Management and Planning Tools solution.Scientific Symbols Chart
ConceptDraw PRO is the beautiful design software that provides many vector stencils, examples and templates for drawing different types of illustrations and diagrams.Mathematics Solution from the Science and Education area of ConceptDraw Solution Park includes a few shape libraries of plane, solid geometric figures, trigonometrical functions and greek letters to help you create different professional looking mathematic illustrations for science and education.
 Seven Management and Planning Tools
Seven Management and Planning Tools solution extends ConceptDraw PRO and ConceptDraw MINDMAP with features, templates, samples and libraries of vector stencils for drawing management mind maps and diagrams.
Business People Figures
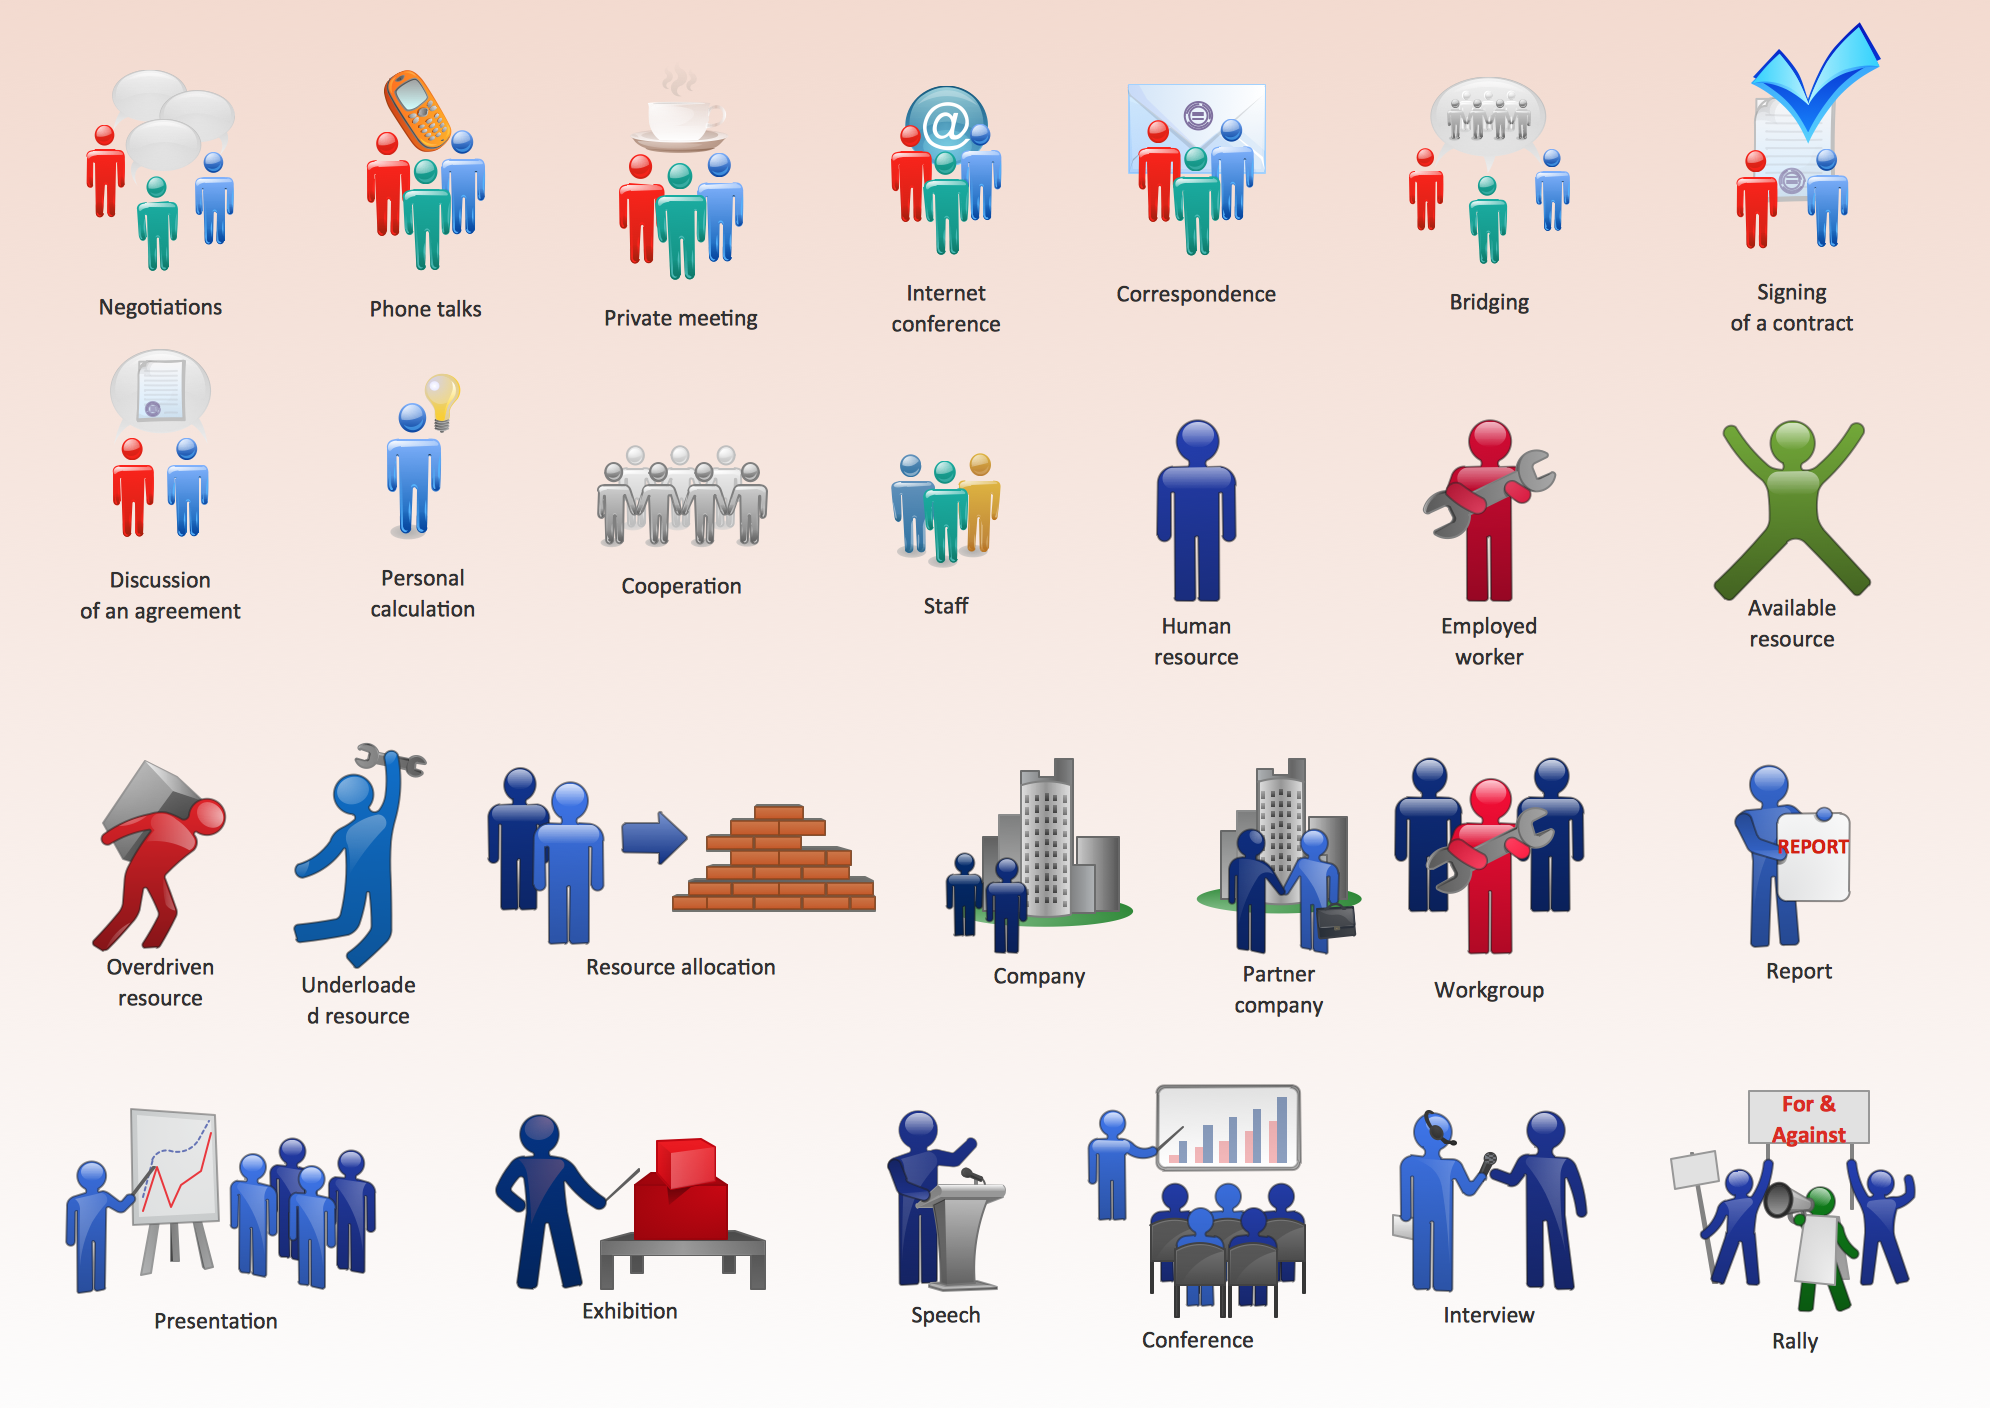
Nowdays business people’s figures are most favourite vector illustrations among presenters and designers. It is easy to make them and use, but they can make your graphics look really good looking & eye catching. Just check ConceptDraw business perople figusers pictures, you will see all kinds of silhouetes: Staff, Employed workers, Persons and Groups symbols. Best popular vector pictures are: men, dancing people, business man. Use human contours wise and it will help you to tell main idea of your design message.CORRECTIVE ACTIONS PLANNING. PERT Chart
The PERT Chart is constructed as part of the process in creating a schedule of corrective actions. The PERT Chart shows the logical connections and consequence of tasks to be performed. It displays the time period for problem solving and the implementation of all activities through the critical path. ConceptDraw Office suite is a software for corrective actions planning.
HelpDesk
How to Manage Problem Solving Using Seven Management and Planning Tools
Stage by stage gouide on using visual tools to move toward solving the problem.
Decision Making
Decision Making - ConceptDraw Office suite provides visual tools that are given support on the stage of the decision making. The Seven Management and Planning Tools is a set for such diagrams: Affinity Diagram, Relations Diagram, Prioritization Matrix, Root Cause Tree Diagram, Involvement Matrix, PERT Chart, Risk Diagram (PDPC).
CORRECTIVE ACTIONS PLANNING. Involvement Matrix
The Involvement Matrix can identify the distribution of responsibilities and identify roles in a group or team. Use the Involvement Matrix to specify roles and responsibilities of actions in problem solving. ConceptDraw Office suite is a software for corrective actions planning.
 ConceptDraw Solution Park
ConceptDraw Solution Park collects graphic extensions, examples and learning materials
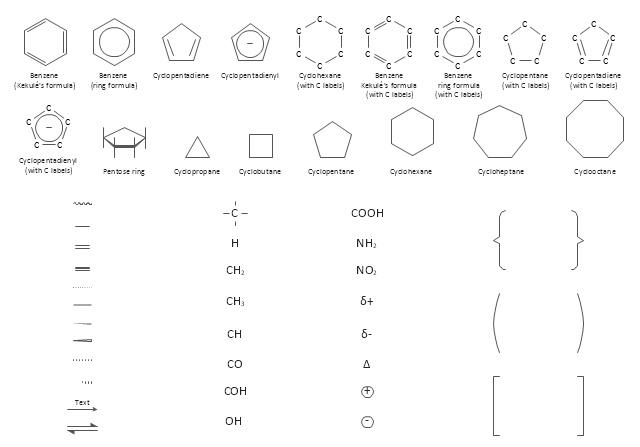
The vector stencils library "Chemical drawings" contains 81 symbols of organic compounds and functional groups for chemical drawing.
Use it to draw structural formulas of organic molecules, schemes of chemical reactions and organic chemistry diagrams.
"Structural drawings.
Organic molecules are described more commonly by drawings or structural formulas, combinations of drawings and chemical symbols. The line-angle formula is simple and unambiguous. In this system, the endpoints and intersections of each line represent one carbon, and hydrogen atoms can either be notated explicitly or assumed to be present as implied by tetravalent carbon. The depiction of organic compounds with drawings is greatly simplified by the fact that carbon in almost all organic compounds has four bonds, nitrogen three, oxygen two, and hydrogen one. ...
Organic reactions.
Organic reactions are chemical reactions involving organic compounds. While pure hydrocarbons undergo certain limited classes of reactions, many more reactions which organic compounds undergo are largely determined by functional groups. The general theory of these reactions involves careful analysis of such properties as the electron affinity of key atoms, bond strengths and steric hindrance. These issues can determine the relative stability of short-lived reactive intermediates, which usually directly determine the path of the reaction.
The basic reaction types are: addition reactions, elimination reactions, substitution reactions, pericyclic reactions, rearrangement reactions and redox reactions. ...
Each reaction has a stepwise reaction mechanism that explains how it happens in sequence - although the detailed description of steps is not always clear from a list of reactants alone.
The stepwise course of any given reaction mechanism can be represented using arrow pushing techniques in which curved arrows are used to track the movement of electrons as starting materials transition through intermediates to final products." [Organic chemistry. Wikipedia]
The chemical symbols example "Design elements - Chemical drawings" was created using the ConceptDraw PRO software extended with the Chemistry solution from the Science and Education area of ConceptDraw Solution Park.
- Sample Pictures Of Affinity Diagram
- Affinity Diagram | Affinity Diagram Software | PDPC | Pdf Affinity ...
- Affinity Diagrams Examples
- Affinity Diagram Software | ConceptDraw Solution Park | Design ...
- Examples of Flowcharts, Org Charts and More | Quality | Affinity ...
- Affinity Diagram | Life cycle analysis - Ring chart | Pyramid Chart ...
- Emergency Plan | Affinity Diagram | PDPC | Chart Which Can Be ...
- Affinity Diagram | Affinity diagram - Template | How To Create an ...
- Affinity Diagram | Seven Management and Planning Tools | PDPC ...
- Astronomy | UK Map | Education | Example Pictures Of Natural ...
- Venn Diagram Examples In Natural Science
- Affinity Diagram | Seven Management and Planning Tools | Diagram ...
- Example Of Affinity Diagram
- Mathematics Symbols | Mathematical Diagrams | Basic ...
- Affinity Diagram | Affinity Diagram Software | PDPC | How To Use ...
- Affinity Diagram | Best Value Stream Mapping mac Software | Cross ...
- Process Diagrams | Affinity Diagram | Bar Diagram Math | Easy ...
- Use the Best FlowChart Tool for the Job | Affinity diagram - Checkout ...
- Cause and effect diagram - Increase in productivity | Drawing ...
- Natural Design To Make Flow Chart On Method Of Education


