Concept Map
A concept map is a way of representing relationships between ideas, images, or words.How to draw a Concept Map quick, easy and effective? ConceptDraw DIAGRAM offers the unique Concept Maps Solution from the "Diagrams" Area that will help you!
Concept Maps
The technique of concept mapping was developed as a constructive way of representing knowledge in science and increasing the meaningfulness of learning. Now, the creation of a concept map is extremely helpful when used in education as learning and teaching techniques that assist memorization. Concept maps are also used for idea generation in brainstorming sessions, and for detailing the structure of complex ideas.
Mac Compatible Remote Presentation
Mac compatible remote presentation, A simple way to share your presentation remotely via Skype. All participants receive presentation file.Applications
Use ConceptDraw MINDMAP for creative thinking, planning, organization, problem solving, presentations, decision making, note taking, team brainstorming and other tasks.Quality Mind Map
This solution extends ConceptDraw MINDMAP software with Quality Management Mind Maps (Presentations, Meeting Agendas, Problem to be solved).
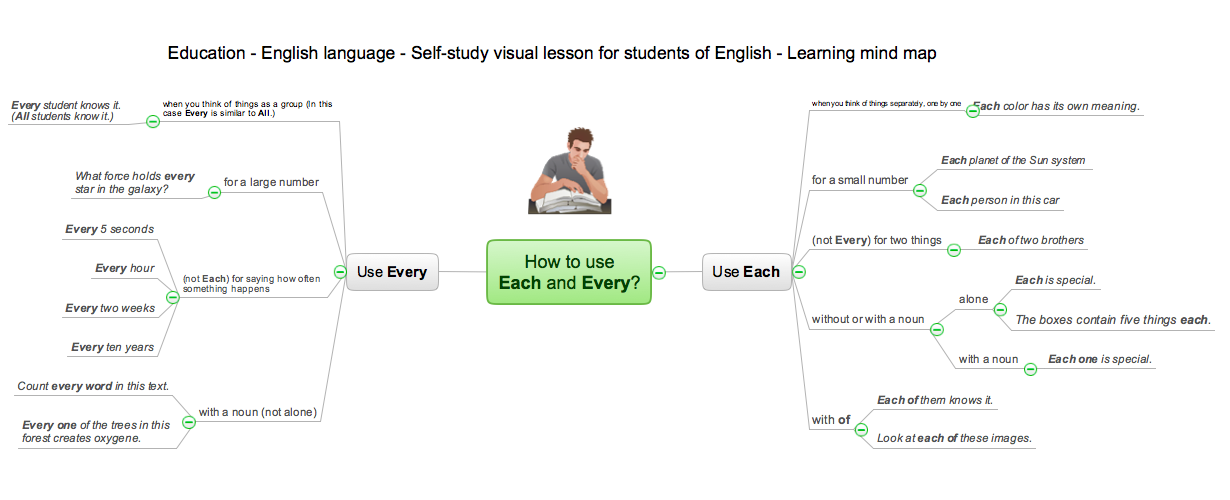
Language School E-Learning
E-Learning in Schools: Online Language Teaching tools. E-Learning software for remote presentations with Skype. Best practices for eLearning.Cylinder Venn Diagram
You need design Cylinder Venn Diagram? Nothing could be easier with ConceptDraw DIAGRAM diagramming and vector drawing software extended with Venn Diagrams Solution from the “Diagrams” Area. ConceptDraw DIAGRAM allows you to design various Venn Diagrams including Cylinder Venn Diagrams.Swot Analysis Examples
SWOT Analysis solution from ConceptDraw Solution Park extends ConceptDraw DIAGRAM software with SWOT and TOWS matrix diagram examples and templates, that help identify and analyze Strengths, Weaknesses, Opportunities, and Threats.Bar Diagrams for Problem Solving. Create space science bar charts with Bar Graphs Solution
Bar charts represent data in different categories or groups.Create bar graphs for visual solving your scientific problems and data comparison using the ConceptDraw DIAGRAM diagramming and vector drawing software extended with the Bar Graphs Solution from the Graphs and Charts area of ConceptDraw Solition Park.
Venn Diagram Examples for Problem Solving. Environmental Social Science. Human Sustainability Confluence
The Venn diagram example below shows sustainable development at the confluence of three constituent parts.Create your Venn diagrams for problem solving in environmental social science using the ConceptDraw DIAGRAM diagramming and vector drawing software extended with the Venn Diagrams solution from the area "Diagrams" of ConceptDraw Solution Park.
- Mind Maps In Science Examples
- Mind Map Science Solutions
- Science Solutions Mind Map
- Biochemistry Topics For Mind Map
- Education And Science Mind Map
- Mind Maps Examples Science
- Sample Concept Map For Science
- Examples Of Mind Mapping Diagrams
- How To Plan and Implement Projects Faster | Concept Maps ...
- Venn Diagrams | Mind Map On Sustainable Development
- ERD | Entity Relationship Diagrams, ERD Software for Mac and Win
- Flowchart | Basic Flowchart Symbols and Meaning
- Flowchart | Flowchart Design - Symbols, Shapes, Stencils and Icons
- Flowchart | Flow Chart Symbols
- Electrical | Electrical Drawing - Wiring and Circuits Schematics
- Flowchart | Common Flowchart Symbols