Network Diagram Examples
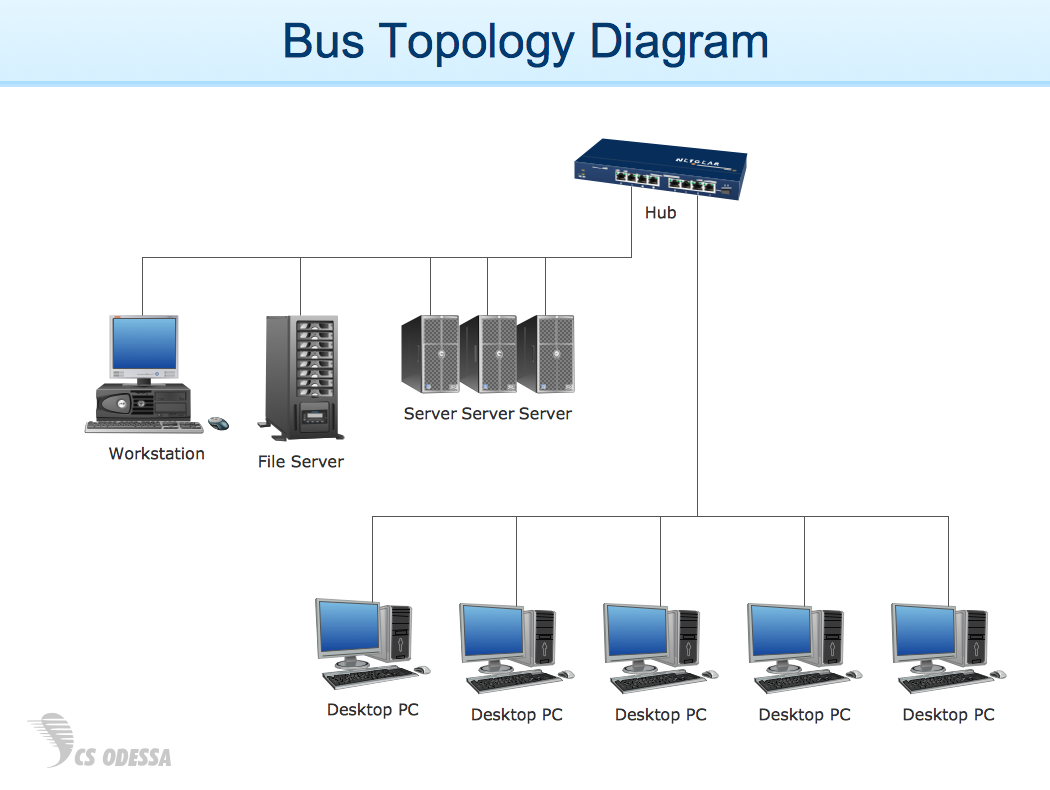
Network diagram is a chart which represents nodes and connections between them in computer network or any telecommunication network, it is a visual depiction of network architecture, physical or logical network topology. There are used common icons for the Network diagrams design, such as icons of various network appliances, computer devices, routers, clouds, peripheral devices, digital devices, etc. Network diagrams can represent networks of different scales (LAN level, WAN level) and detailization. ConceptDraw DIAGRAM diagramming software enhanced with Computer Network Diagrams solution from Computer and Networks area includes huge collection of computer and network templates, design objects and stencils, and numerous quantity of Network diagram examples and samples, among them: Basic Computer Network Diagrams, Communication Network Diagram, Wireless Router Network Diagram, LAN Topology Diagram, Computer Network System Design Diagram, Mobile Satellite Communication Network, Web-based Network Diagram, Hybrid Network Diagram, and many others.
 ConceptDraw Solution Park
ConceptDraw Solution Park collects graphic extensions, examples and learning materials
 Fishbone Diagram
Fishbone Diagrams solution extends ConceptDraw DIAGRAM software with templates, samples and library of vector stencils for drawing the Ishikawa diagrams for cause and effect analysis.
 Value Stream Mapping
Value stream mapping solution extends ConceptDraw DIAGRAM software with templates, samples and vector stencils for drawing the Value Stream Maps (VSM) in lean manufacturing practice.
Bubble diagrams in Landscape Design with ConceptDraw DIAGRAM
Bubble Diagrams are the charts with a bubble presentation of data with obligatory consideration of bubble's sizes. They are analogs of Mind Maps and find their application at many fields, and even in landscape design. At this case the bubbles are applied to illustrate the arrangement of different areas of future landscape design, such as lawns, flowerbeds, playgrounds, pools, recreation areas, etc. Bubble Diagram helps to see instantly the whole project, it is easy for design and quite informative, in most cases it reflects all needed information. Often Bubble Diagram is used as a draft for the future landscape project, on the first stage of its design, and in case of approval of chosen design concept is created advanced detailed landscape plan with specification of plants and used materials. Creation of Bubble Diagrams for landscape in ConceptDraw DIAGRAM software is an easy task thanks to the Bubble Diagrams solution from "Diagrams" area. You can use the ready scanned location plan as the base or create it easy using the special ConceptDraw libraries and templates.
 Accounting Flowcharts
Accounting Flowcharts solution extends ConceptDraw DIAGRAM software with templates, samples and library of vector stencils for drawing the accounting flow charts.
Excellent Examples of Infographic Maps
Create Spatial infographics with ConceptDraw using its excellent examples of infographic maps. We hope these can inspire and teach you!
 Cross-Functional Flowcharts
Cross-functional flowcharts are powerful and useful tool for visualizing and analyzing complex business processes which requires involvement of multiple people, teams or even departments. They let clearly represent a sequence of the process steps, the order of operations, relationships between processes and responsible functional units (such as departments or positions).
- Example of Flowchart Diagram | How to Draw a Flowchart | Create a ...
- Example of Flowchart Diagram | Flowchart Program Mac | Best ...
- Diagram Flow Chart | Example of Flowchart Diagram | Flow Chart
- Business Productivity Diagramming | Pyramid Chart Examples ...
- SWOT Sample in Computers | One formula of professional mind ...
- Example Process Flow | Example of Flowchart Diagram | Flow Chart ...
- Cross-Functional Flowcharts | Flow Chart Diagram Examples ...
- Business Process Diagram | Example of Flowchart Diagram ...
- Create a Flow Chart | Example of Flowchart Diagram | How to Draw ...
- Flow Chart Diagram Examples | Example of Flowchart Diagram ...
- Example of Flowchart Diagram | Flow Chart Diagram Examples ...
- Example of Flowchart Diagram | Flow Chart Diagram Examples ...
- Diagram Flow Chart | Example of Flowchart Diagram | Flowchart ...
- Example of Flowchart Diagram | Accounting Flowcharts | Cross ...
- Flow Chart Diagram Examples
- Professional Diagram and Flowchart Software | Business ...
- Flow Chart Diagram Examples | Data Flow Diagrams | ConceptDraw ...
- Fishbone Diagram | ConceptDraw Solution Park is an online ...
- Flow process chart | Example Process Flow | Example of Flowchart ...
- Example of Flowchart Diagram


