Flow chart Example. Warehouse Flowchart


Copying Service Process Flowchart. Flowchart Examples

Purchasing Flowchart - Purchase Order. Flowchart Examples

 Logistics Flow Charts
Logistics Flow Charts solution extends ConceptDraw DIAGRAM functionality with opportunities of powerful logistics management software. It provides large collection of predesigned vector logistic symbols, pictograms, objects and clipart to help you design with pleasure Logistics flow chart, Logistics process flow diagram, Inventory flow chart, Warehouse flowchart, Warehouse management flow chart, Inventory control flowchart, or any other Logistics diagram. Use this solution for logistics planning, to reflect logistics activities and processes of an enterprise or firm, to depict the company's supply chains, to demonstrate the ways of enhancing the economic stability on the market, to realize logistics reforms and effective products' promotion.
 Manufacturing and Maintenance
Manufacturing and maintenance solution extends ConceptDraw DIAGRAM software with illustration samples, templates and vector stencils libraries with clip art of packaging systems, industrial vehicles, tools, resources and energy.
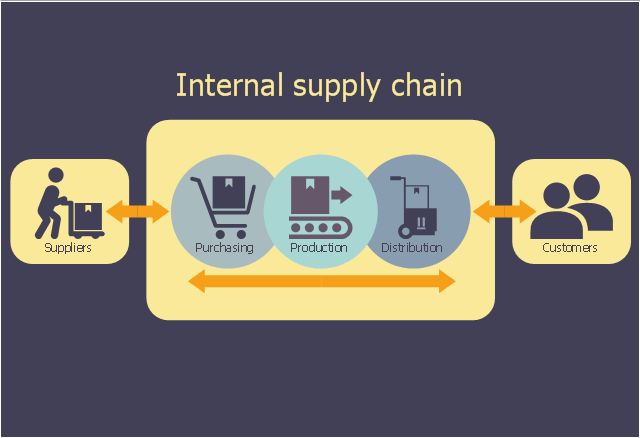
This logistic flow chart sample shows the company's supply chain. It was designed on the base of the Wikimedia Commons file: A company's supply chain (en).png. [commons.wikimedia.org/ wiki/ File:A_ company%27s_ supply_ chain_ (en).png]
This file is licensed under the Creative Commons Attribution-Share Alike 3.0 Unported license. [creativecommons.org/ licenses/ by-sa/ 3.0/ deed.en]
"A supply chain is a system of organizations, people, activities, information, and resources involved in moving a product or service from supplier to customer. Supply chain activities involve the transformation of natural resources, raw materials, and components into a finished product that is delivered to the end customer. In sophisticated supply chain systems, used products may re-enter the supply chain at any point where residual value is recyclable. Supply chains link value chains." [Supply chain. Wikipedia]
The logistic flowchart example "A company's supply chain" was created using ConceptDraw PRO diagramming and vector drawing software extended with the Logistics Flow Charts solution from the Business Processes area of ConceptDraw Solution Park.
Logistic flowchart
This picture graph sample shows how does manufacturing compare with other industries in U.S. It was designed using data from the U.S. Census Bureau website. [census.gov/ how/ img/ manufacturing_ 2014_ th.jpg]
"Manufacturing is the production of merchandise for use or sale using labour and machines, tools, chemical and biological processing, or formulation. The term may refer to a range of human activity, from handicraft to high tech, but is most commonly applied to industrial production, in which raw materials are transformed into finished goods on a large scale. Such finished goods may be used for manufacturing other, more complex products, such as aircraft, household appliances or automobiles, or sold to wholesalers, who in turn sell them to retailers, who then sell them to end users and consumers." [Manufacturing. Wikipedia]
The arrows bar chart example "Manufacturing in America" was created using the ConceptDraw PRO diagramming and vector drawing software extended with the Picture Graphs solution from the Graphs and Charts area of ConceptDraw Solution Park.
Arrows bar chart

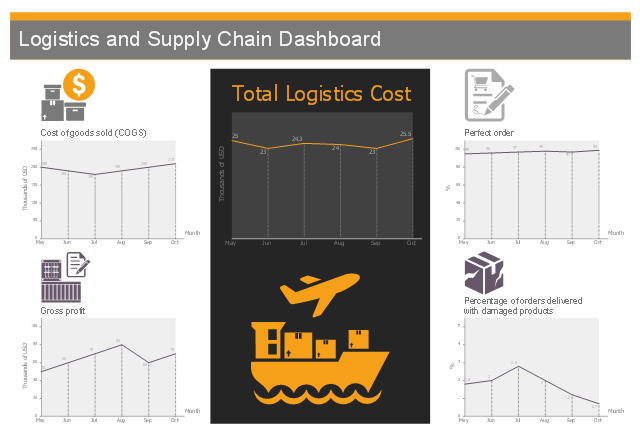
This business dashboard example shows 5 line charts of logistics and supply chain business metrics.
"A supply chain is a system of organizations, people, activities, information, and resources involved in moving a product or service from supplier to customer. Supply chain activities involve the transformation of natural resources, raw materials, and components into a finished product that is delivered to the end customer." [Supply chain. Wikipedia]
The performance dashboard example "Logistics and Supply Chain Dashboard" was designed using ConceptDraw PRO software extended with Logistic Dashboard solution from Business Processes area of ConceptDraw Solution Park.
Logistic dashboard
Business Process Flowchart Symbols

Value stream with ConceptDraw DIAGRAM

- Raw Material Stores Layout
- Warehouse layout floor plan | Warehouse with conveyor system ...
- Logistics Flow Charts | Fishbone Diagrams | Raw Material Flowchart
- Warehouse And Storage Layout Example
- Picture graph - Template | Manufacturing in America | Total value of ...
- Material Requisition Flowchart. Flowchart Examples | Purchasing ...
- Warehouse layout floor plan | Commercial Building Layout
- Plant Layout Plans | Factory layout floor plan | Cafe and Restaurant ...
- Equipments And Their Symbols In Chemical Industry
- Design elements - Industrial equipment | Design elements ...