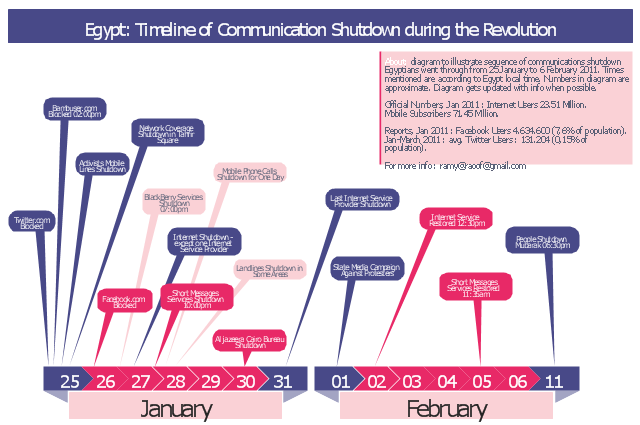
This typography infographics example was redesigned from the Wikimedia Commons file: Egypt timeline of communication shutdown during jan25revolution.jpg. [commons.wikimedia.org/ wiki/ File:Egypt_ timeline_ of_ communication_ shutdown_ during_ jan25revolution.jpg]
This file is licensed under the Creative Commons Attribution 3.0 Unported license. [creativecommons.org/ licenses/ by/ 3.0/ deed.en]
Diagram to illustrate sequence of communications shutdown Egyptians went through from 25 January to 06 February 2011. Times mentioned are according to Egypt local time. Numbers in the diagram are approximate. Last update of the diagram October 2011.
"2011 Internet shutdown.
Diagram to illustrate sequence of communications shutdown Egyptians went through from 25 January to 06 February 2011. Times mentioned are according to Egypt local time. Numbers in the diagram are approximate. Last update of the diagram October 2011.
The 2011 Egyptian protests began on 25 January 2011. As a result, on January 25 and 26, the government blocked Twitter in Egypt and later Facebook was blocked as well.
On January 27, various reports claimed that access to the Internet in the entire country had been shut down. ...
On February 2, connectivity was re-established by the four main Egyptian service providers. A week later, the heavy filtering that occurred at the height of the revolution had ended and bloggers and online activists who had been arrested were released." [Internet in Egypt. Wikipedia]
The example "Egypt timeline of communication shutdown during jan 25 revolution" was created using the ConceptDraw PRO diagramming and vector drawing software extended with the Typography Infographics solition from the area "What is infographics" in ConceptDraw Solution Park.
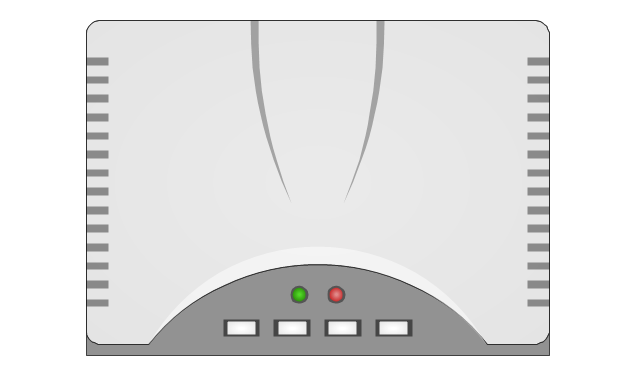
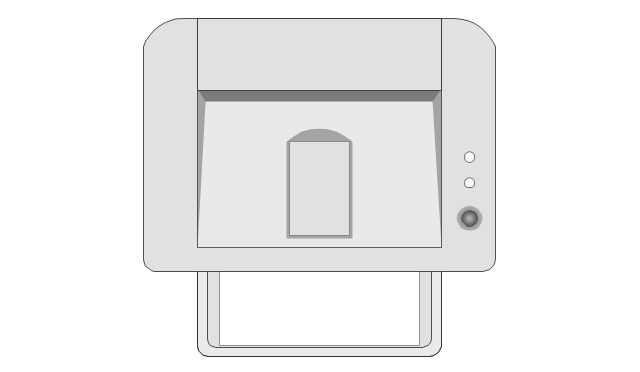
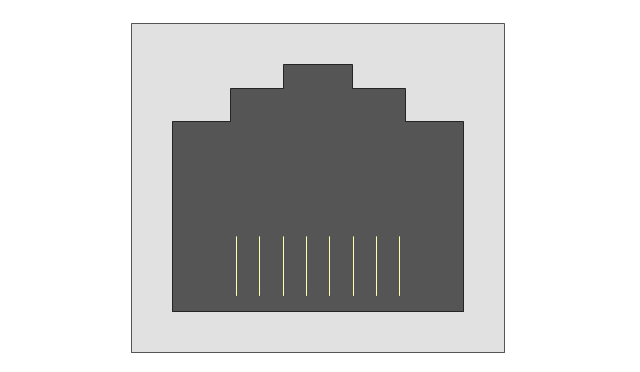
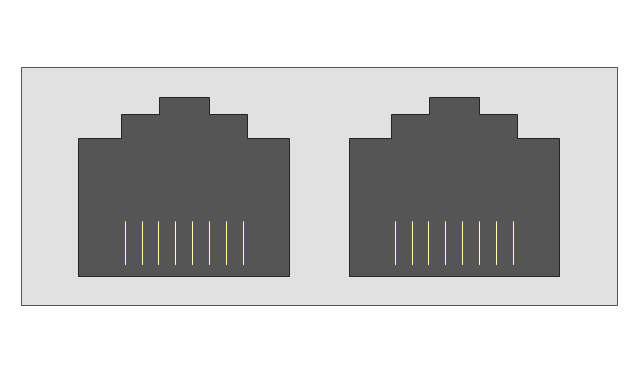
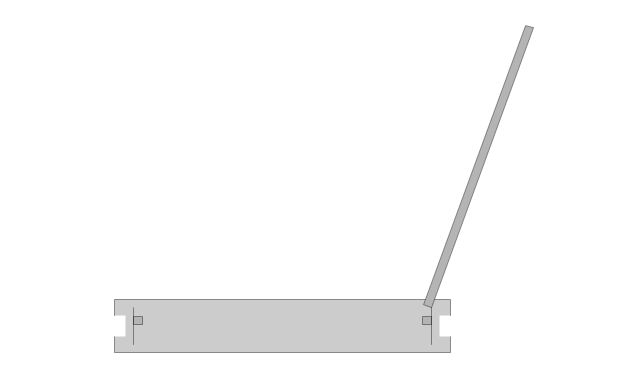
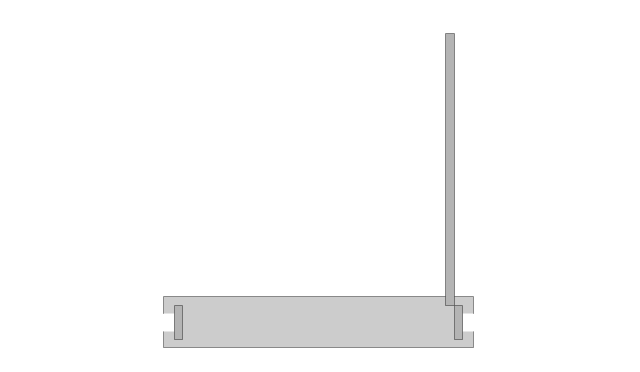
The vector stencils library "Network layout floorplan" contain 34 symbol icons for drawing computer network floor plans, communication equipment layouts, and structured cabling diagrams.
"Structured cabling is building or campus telecommunications cabling infrastructure that consists of a number of standardized smaller elements (hence structured) called subsystems. ...
Structured cabling design and installation is governed by a set of standards that specify wiring data centers, offices, and apartment buildings for data or voice communications using various kinds of cable, most commonly category 5e (CAT-5e), category 6 (CAT-6), and fibre optic cabling and modular connectors. These standards define how to lay the cabling in various topologies in order to meet the needs of the customer, typically using a central patch panel (which is normally 19 inch rack-mounted), from where each modular connection can be used as needed. Each outlet is then patched into a network switch (normally also rack-mounted) for network use or into an IP or PBX (private branch exchange) telephone system patch panel." [Structured cabling. Wikipedia]
The design elements example "Network layout floorplan - Vector stencils library" was created using the ConceptDraw PRO diagramming and vector drawing software extended with the Network Layout Floor Plans solution from the Computer and Networks area of ConceptDraw Solution Park.
Basic Flowchart Symbols and Meaning
Flowcharts are the best for visually representation the business processes and the flow of a custom-order process through various departments within an organization. ConceptDraw DIAGRAM diagramming and vector drawing software extended with Flowcharts solution offers the full set of predesigned basic flowchart symbols which are gathered at two libraries: Flowchart and Flowcharts Rapid Draw. Among them are: process, terminator, decision, data, document, display, manual loop, and many other specific symbols. The meaning for each symbol offered by ConceptDraw gives the presentation about their proposed use in professional Flowcharts for business and technical processes, software algorithms, well-developed structures of web sites, Workflow diagrams, Process flow diagram and correlation in developing on-line instructional projects or business process system. Use of ready flow chart symbols in diagrams is incredibly useful - you need simply drag desired from the libraries to your document and arrange them in required order. There are a few serious alternatives to Visio for Mac, one of them is ConceptDraw DIAGRAM. It is one of the main contender with the most similar features and capabilities.
 ATM UML Diagrams
The ATM UML Diagrams solution lets you create ATM solutions and UML examples. Use ConceptDraw DIAGRAM as a UML diagram creator to visualize a banking system.
 Scatter Diagrams
The Scatter Diagrams solution extends ConceptDraw DIAGRAM functionality with templates, samples, and a library of vector stencils that make construction of a Scatter Plot easy. The Scatter Chart Solution makes it easy to design attractive Scatter Diagrams used in various fields of science, work, and life activities. ConceptDraw DIAGRAM lets you enter the data to the table and construct the Scatter Plot Graph automatically according to these data.
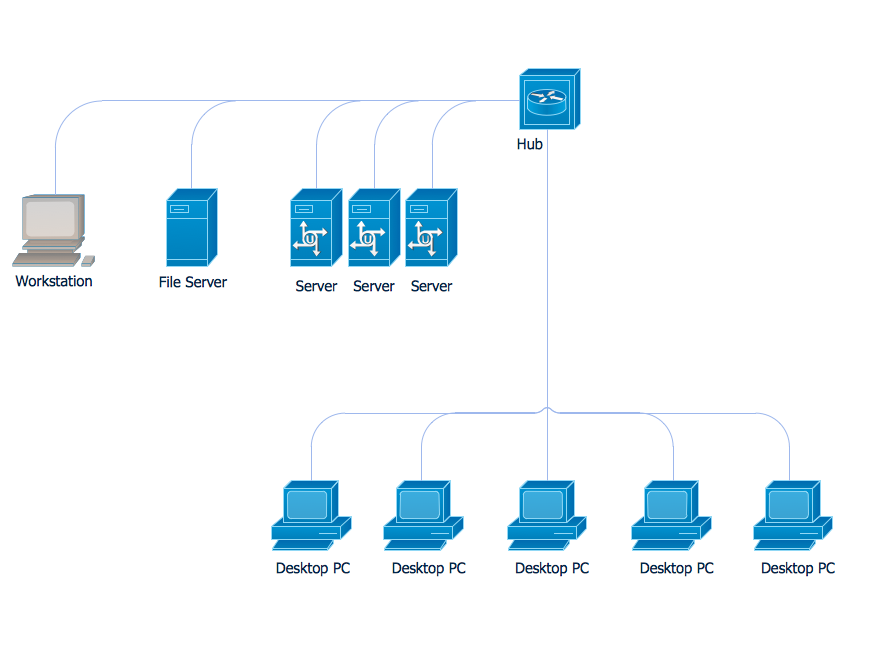
Communication Network Topology
This sample was created in ConceptDraw DIAGRAM diagramming and vector drawing software using the Computer and Networks solution from Computer and Networks area of ConceptDraw Solution Park. A communication network topology is defined by the evaluating costs of the states. Each state represents the possible distribution of the hubs and remote nodes to nodes of the communication network.Interior Design. Office Layout Plan Design Element
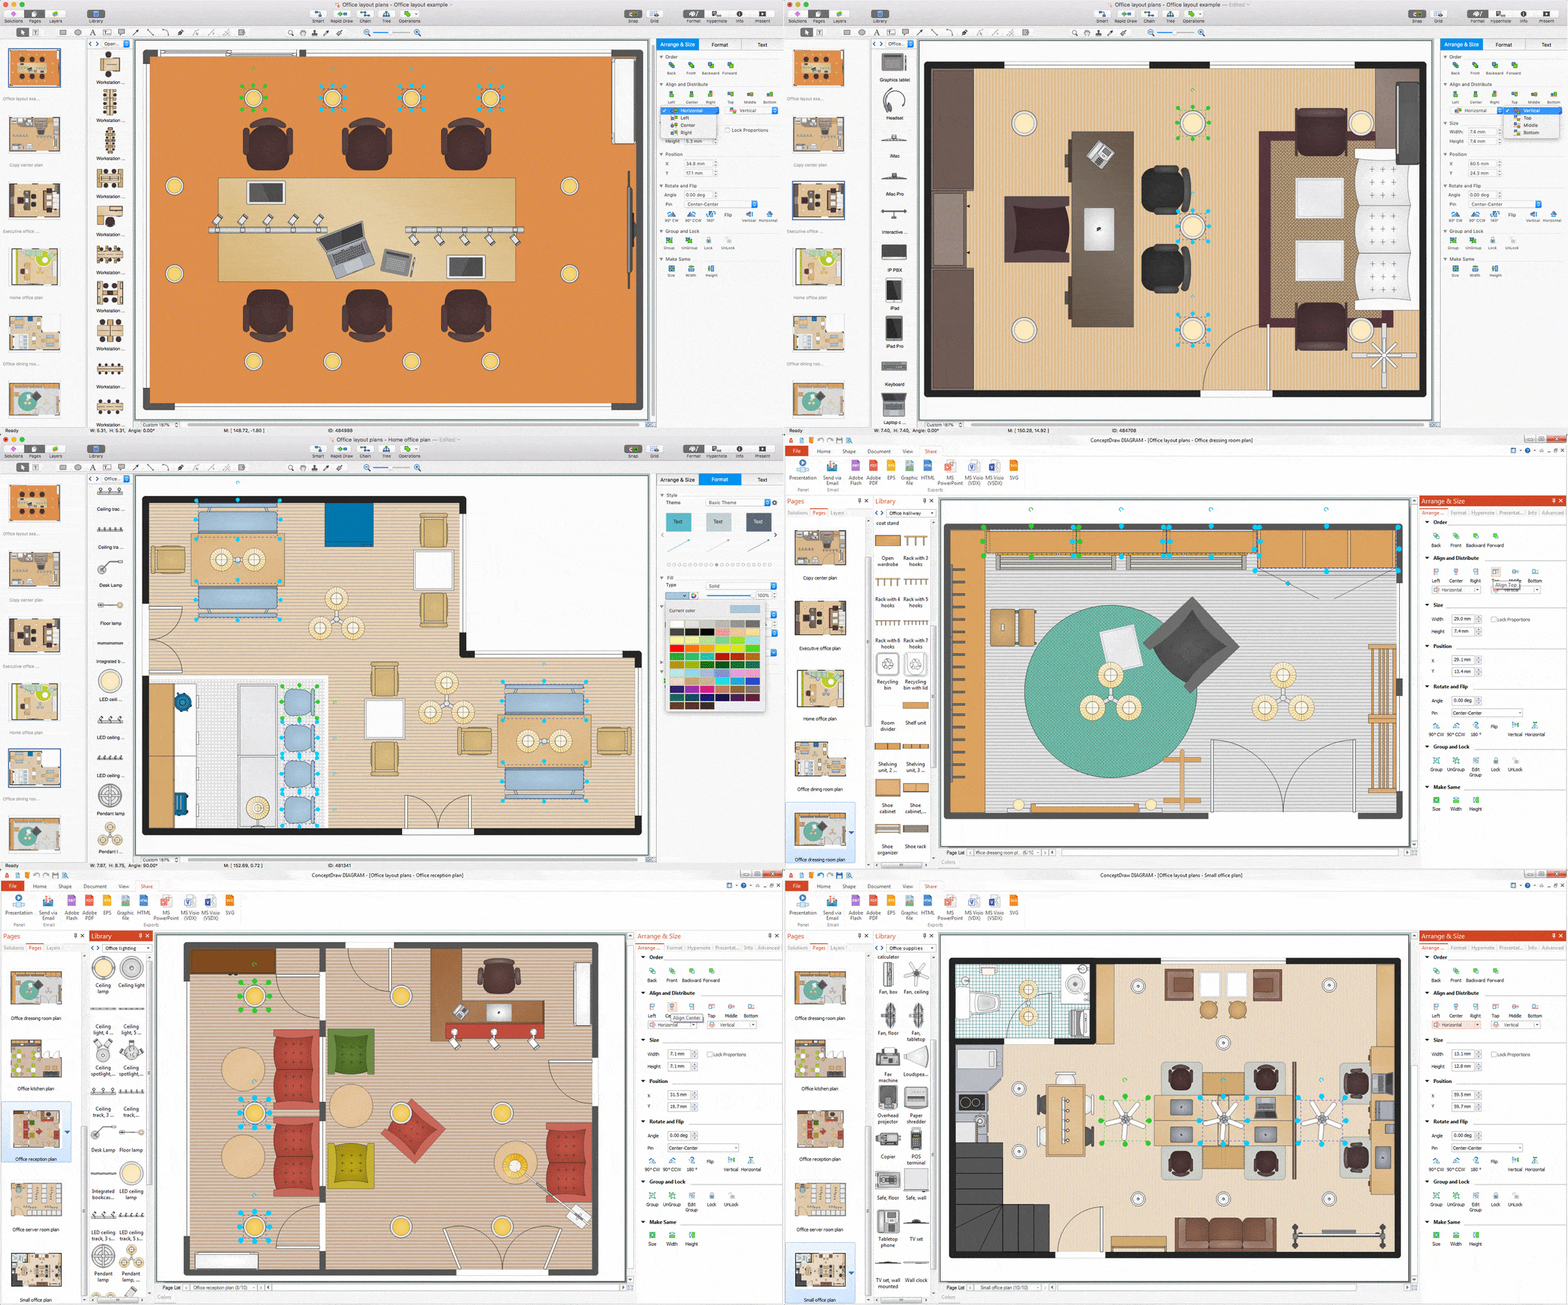
Lucky interior design is an integral part of succesful work at office. The important challenge in office design planning is to find a balance between two main office activities: concentration and communication. Primarily you need to determine with a type of office space, this can be an open space or separate rooms. The first type is more suitable for communication and rapid interaction. That's why open offices and combined spaces are modern types of work space and often used, especially for private offices. Traditional office basically represents separate rooms arranged along the corridor. It is applied for the companies with small number of people or for enterprises divided on separate departments, and is practically inapplicable for teamwork. ConceptDraw DIAGRAM diagramming and vector drawing software extended with Office Layout Plans solution offers a lot of vector stencils libraries with design elements of office furniture and equipment for effective office interior design and office space planning, for easy creation Office Floor Plans and Office Layout Plans. Use ConceptDraw DIAGRAM to visualize process flowcharts, network architecture and program workflows like Visio for Mac and even more. The software can be used with different fields like business, engineering and construction, etc.
Root Cause Analysis
The Seven Management and Planning Tools is a tool for Root Cause Analysis Tree Diagram drawing. This diagram is for Root Cause Analysis. Analyze the root causes for factors that influenced the problem. This diagram is constructed separately for each highly prioritized factor. The goal of this is to find the root causes for the factor and list possible corrective action.
IDEF0 standard with ConceptDraw DIAGRAM
The activity of any organization is more or less branchy network of processes. The description of these processes is a hard technical task which requires definite methodology and standards. According to the IDEF0 standard any process can be described in the form of a block (Activity Box) which has inputs and outputs. The process consists in transformation of inputs into outputs under the influence of the management and in the presence of necessary resources. Outputs of the given process later on can be either inputs for the next process or resources, or management means."Intelligent vehicular ad hoc networks (InVANETs) use WiFi IEEE 802.11p (WAVE standard) and WiMAX IEEE 802.16 for easy and effective communication between vehicles with dynamic mobility. Effective measures such as media communication between vehicles can be enabled as well methods to track automotive vehicles. InVANET is not foreseen to replace current mobile (cellular phone) communication standards . ...
Communication capabilities in vehicles are the basis of an envisioned InVANET or intelligent transportation systems (ITS). Vehicles are enabled to communicate among themselves (vehicle-to-vehicle, V2V) and via roadside access points (vehicle-to-roadside, V2R) also called as Road Side Units (RSUs). Vehicular communication is expected to contribute to safer and more efficient roads by providing timely information to drivers, and also to make travel more convenient. The integration of V2V and V2R communication is beneficial because V2R provides better service sparse networks and long distance communication, whereas V2V enables direct communication for small to medium distances/ areas and at locations where roadside access points are not available." [Intelligent vehicular ad-hoc network. Wikipedia]
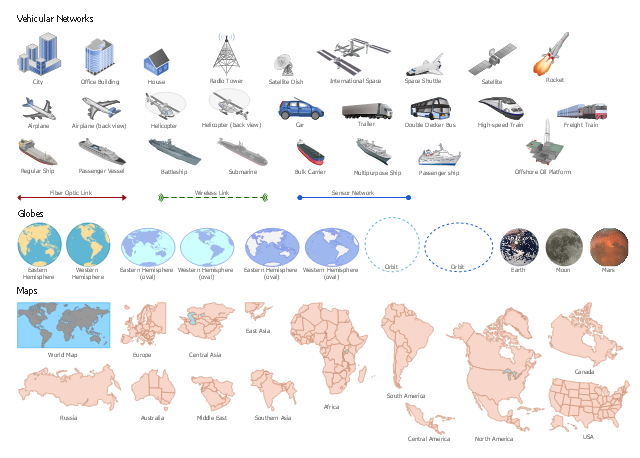
The vector stencils library "Global networks" contains 63 symbols for drawing the global network diagrams using the ConceptDraw PRO diagramming and vector drawing software.
The example "Design elements - Global networks" is included in the Vehicular Networking solution from the Computer and Networks area of ConceptDraw Solution Park.
- Digital Communications Network. Computer and Network Examples ...
- Digital Communications Network. Computer and Network Examples ...
- Network Layout Floor Plans | Network equipment and cabling layout ...
- Design elements - Telecom | Network layout floorplan - Vector ...
- Visible light communication | Road signs - Vector stencils library ...
- Network Layout | Network Diagram Examples | Design Element ...
- Wide area network (WAN) topology. Computer and Network Examples
- Network layout floorplan - Vector stencils library | Logical symbols ...
- Network Floor Plan
- Network layout floorplan - Vector stencils library | Spatial ...
