HelpDesk
How to Input Data from MS Excel Into a Mind Map
Many people apply Excel documents to store data in the form of hierarchical lists. With ConceptDraw MINDMAP you can easily turn the linear structure of an Excel table in a radial structure of mind map ConceptDraw MINDMAP will create a mind map file (CDMZ) from your Excel (XLS) file. If you keep your information in the Microsoft Excel files, you can import them into ConceptDraw MINDMAP, converting the columns and rows to a hierarchical structured mind map. If you have multiple individual sheets in your Excel workbook, ConceptDraw MINDMAP will turn them into a single multi-page mind map. ConceptDraw MINDMAP lets you import an entire Microsoft® Excel file as well as insert data from the selected cells.HelpDesk
How to Create a Sales Dashboard Using ConceptDraw PRO
Visual dashboard is a valuable tool for any sales team. Sales dashboard allows you to view and monitor sales indicators that are important for manager and sales staff . It helps to use the timely and reliable information to improve the quality of sales performance and increase sales revenues. ConceptDraw Sales Dashboard solution is a tool for both: sales manager and sales team. It provides the visualization of key performance indicators that are critical to the entire sales organization. The custom sales dashboard displays the real-time information on sales performance KPIs with the help of intuitive and easy-to-understand diagrams and charts.
HelpDesk
How to Draw a Scatter Diagram Using ConceptDraw PRO
Scatter Diagrams are used to visualize how a change in one variable affects another. A Scatter Diagram displays the data as a set of points in a coordinate system. It combines these values into single data points and displays them in uneven intervals. A Scatter Diagram can be very useful to for identifying relationships between variables, for example the relationship of price and quality rating. Making a Scatter Diagram involves many different elements that can be managed using ConceptDraw Scatter Diagram solution.HelpDesk
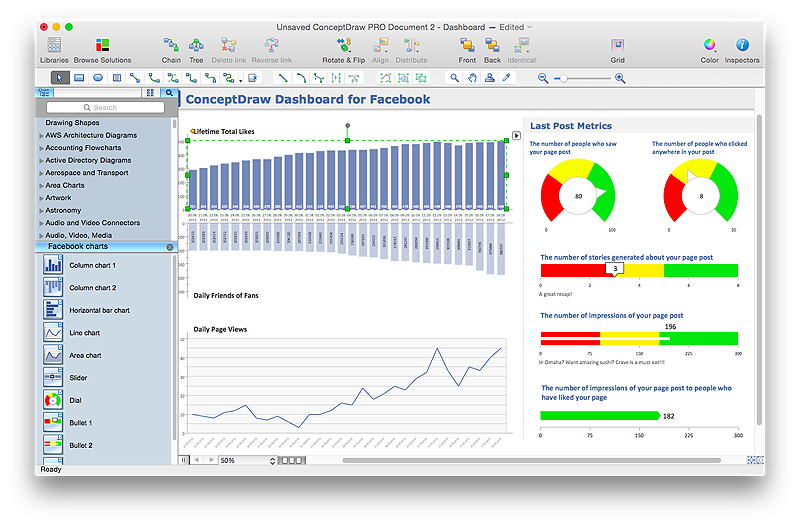
How to Use ConceptDraw Dashboard for Facebook on OS X
The ConceptDraw Dashboard for Facebook Solution is a visual dashboard that visualizes lifetime total Likes, daily Friends of Fans, and daily Page views based on the information exported from your Facebook Page.HelpDesk
How to Use ConceptDraw Sales Dashboard Solution
The interactive visual dashboard is a valuable tool for any sales team. Sales dashboard allows you to view and monitor sales indicators that are important for manager and sales staff . It helps to use the timely and reliable information to improve the quality of sales performance and increase sales revenues. ConceptDraw Sales Dashboard solution is a tool for both: sales manager and sales team. It provides the visualization of key performance indicators that are critical to the entire sales organization. The custom sales dashboard displays the real-time information on sales performance KPIs with the help of intuitive and easy-to-understand diagrams and charts. Sales Dashboard helps the entire team see where they are, and what needs to be done. With ConceptDraw PRO you can easily create a visual Sales Dashboard using Live Objects Technology.
- Org Chart Excel Template
- Org Chart Template Excel
- Org Structure Template Excel
- Organization Chart Template Excel
- Excel Org Chart Templates
- Create Organizational Chart | Risk diagram (PDPC) - Template ...
- Create Organizational Chart | Design Organogram Template On Excel
- Excel Org Chart Template Download
- Organisation Chart Template In Excel
- Excel Org Chart Template
- Organizational Chart Template Excel
- Excel Organizational Chart Template Free Downloads
- Org Chart Builder Excel
- Gantt Chart Template Excel
- Organogram Software | Flow chart Example. Warehouse Flowchart ...
- Marketing Blocking Chart Template Excel
- Excel Smart Chart
- Organizational Chart Excel How To Do Multiple Reporting Lines
- Organizational Chart Excel
- Sales And Marketing Process Flow Chart


