Pyramid Diagram

Venn Diagram

Business Calendar

Competitor Analysis

 Business Package for Management
Package intended for professional who designing and documenting business processes, preparing business reports, plan projects and manage projects, manage organizational changes, prepare operational instructions, supervising specific department of an organization, workout customer service processes and prepare trainings for customer service personal, carry out a variety of duties to organize business workflow.
Pyramid Diagram

How to Create a Bar Chart

Business Structure
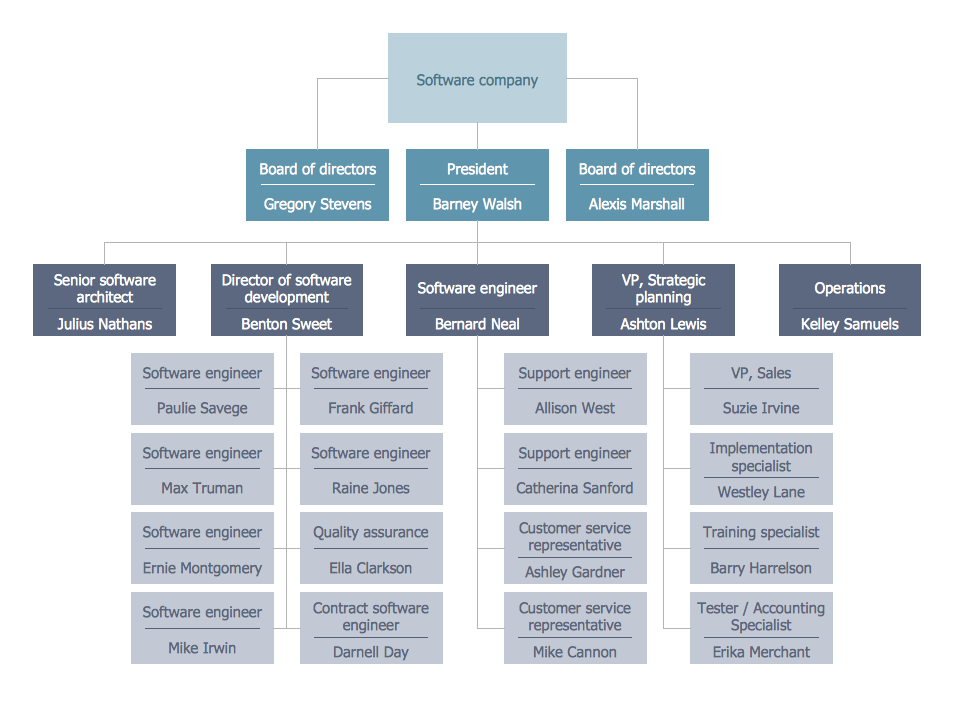
Organization Chart
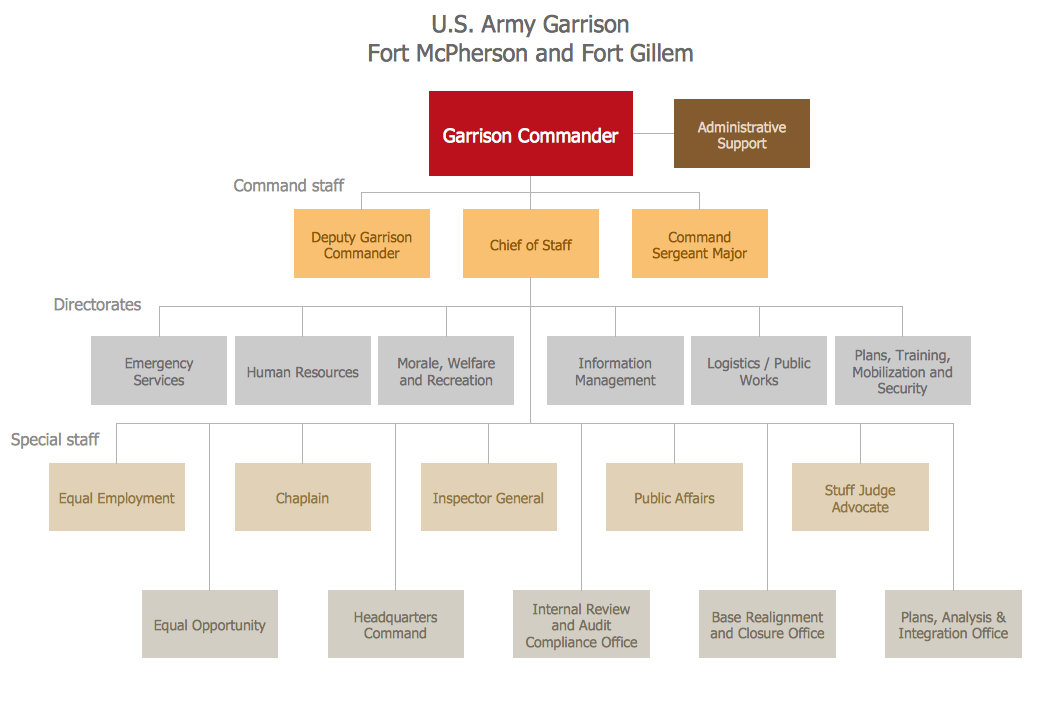
Organization Structure

- Stakeholder Mapping Tool | Visualize Stakeholder Analysis ...
- Flow chart Example. Warehouse Flowchart | Executive Summary Of ...
- Automated payroll management system UML activity diagram | 4 ...
- Stakeholder Onion Diagrams | How to Create a Stakeholder Onion ...
- Management Stakeholder Onion Diagrams
- Stakeholder Onion Diagrams
- Stakeholder diagram | Stakeholder Onion Diagrams | Stakeholder ...
- UML activity diagram - Ticket processing system | UML activity ...
- Pyramid Diagram | 4 Level pyramid model diagram - Information ...
- Research onion diagram | Stakeholder Onion Diagrams | How To ...