Local area network (LAN). Computer and Network Examples
Local Area Network (LAN) is a network which consists of computers and peripheral devices connected each other and to the local domain server, and covers a little territory or small number of buildings, such as home, school, laboratory, office, etc. LAN serves for few hundreds of users. It includes many cables and wires, and demands to design previously a Network diagram. All local area network devices can use the shared printers and disk storage. ConceptDraw DIAGRAM is a perfect network diagramming software with examples of LAN Diagrams, templates and predesigned vector objects. ConceptDraw DIAGRAM is the ideal choice for network engineers and network designers who need to draw fast and easy Local Area Network Diagrams, for IT specialists, developers and other IT professionals which need to visualize the communication schemes of LAN and visually document the LAN's physical structure and arrangement in houses, offices and other buildings. Ready-to-use vector objects from Computer Network Diagrams solution will help you design LAN diagrams in minutes.
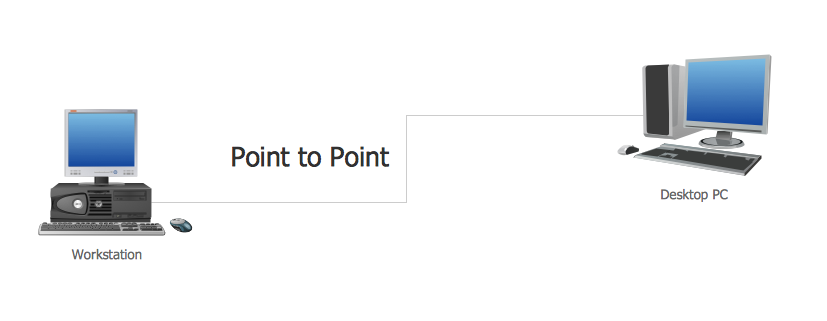
Point to Point Network Topology
This sample was created in ConceptDraw DIAGRAM diagramming and vector drawing software using the Computer and Networks solution from Computer and Networks area of ConceptDraw Solution Park. This sample shows the Point-to-point network topology. Network topology is the topological structure of the computer network. Point-to-point network topology is a simple topology that displays the network of exactly two hosts (computers, servers, switches or routers) connected with a cable. Point-to-point topology is widely used in the computer networking and computer architecture.Metropolitan area networks (MAN). Computer and Network Examples
A Metropolitan Area Network (MAN) is a great computer network located on the large geographical area or region. It is a network bigger than Local Area Network (LAN), but territorially smaller than Wide Area Network (WAN), its diameter usually ranges from 5 to 50 kilometers. MAN usually includes several buildings or even the whole city (metropolis). It is based on high data rate compounds using the fiber channels and other digital data transmission channels. MAN includes a lot of communicating devices, for its construction are used multiple routers, switches and hubs. MAN can combine together several Local Area Networks or Campus Area Networks located in different buildings within a city and provides the Internet connectivity for them. Solutions included to Computer and Networks Area for ConceptDraw Solution Park are the real godsend for those who want design Computer Network Diagrams, and among others the Metropolitan Area Network Diagrams. They offer the libraries with ready-to-use vector design elements, professional-looking examples, samples and templates.
Campus Area Networks (CAN). Computer and Network Examples
Campus Area Network (CAN) is a computer network which provides wireless access to the Internet or LAN for the users located in two or more buildings on the limited geographical area, or in the open space surrounding these buildings. Campus Area Network is usually set in campus of a university or college, but the same kind of planning and design can be applied for other purposes, for enterprises, office buildings, military bases, industrial complexes, public places like supermarkets, entertainment centers, etc. Another form of temporary CAN can exist during some special events such as rallies, music festivals. The elementary Campus Area Network can also arise spontaneously, due to the distance of spread the radio signals from the access points that are not limited by buildings walls. It is also sensible to have additional access points for the larger and more complex CANs, located at specially places chosen for serving clients. Design easy diagrams and schemes for the Campus Area Networks with Computer Network Diagrams solution for ConceptDraw DIAGRAM.
How to Draw a Computer Network Diagrams
ConceptDraw DIAGRAM enhanced with popular Computer Network Diagrams solution from Computer and Networks area of ConceptDraw Solution Park is a powerful vector graphics and computer network diagramming software. It includes templates, samples and 7 libraries with predesigned vector objects of computer network devices, computer peripheral devices, network hardware, external digital devices, internet symbols, logical symbols, to help IT professionals easily visualize network equipment, to draft and present computer and network installations. It assists create easy and even instantly Computer Network Diagrams of various types and complexity, design Wireless Network Schemes, Network Topologies Diagrams, Computer Network System Designs. The list of five the most popular practical applications of Computer Network Diagrams solution includes documentation, presentations, training, workflows, education. A represented video How to Draw a Computer Network Diagram will help to realize effectively your computer network design process.Storage area networks (SAN). Computer and Network Examples
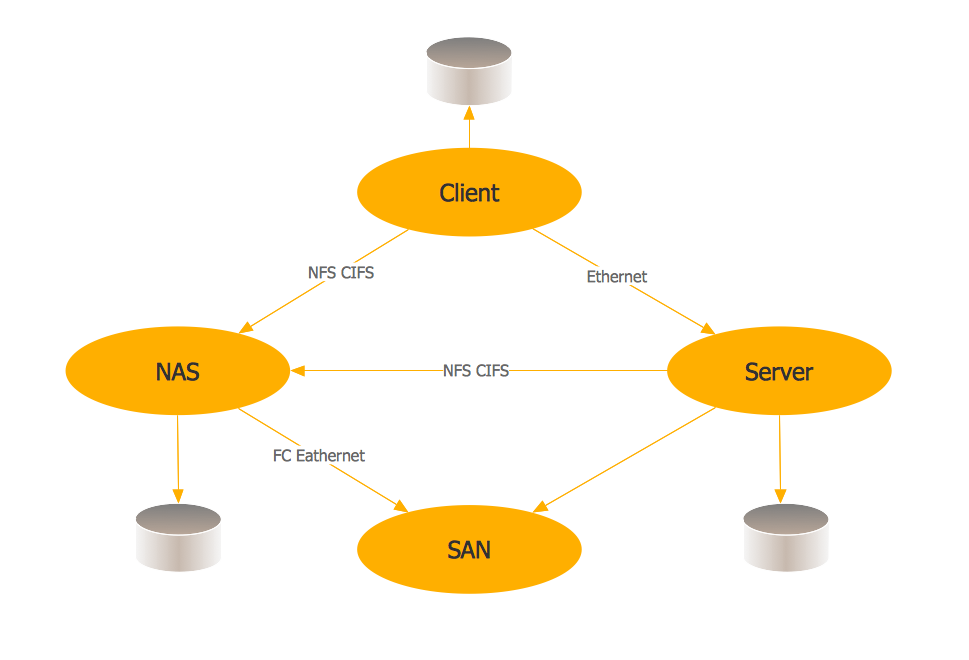
A Storage area network (SAN) is a dedicated network that provides access to data storage and operations only on the block level. SAN usually has own network of storage devices/elements and disk arrays that are connected with each other and to a remote data-sharing network. SANs are widely used for enhancing the storage devices (optical jukeboxes, disk arrays, tape libraries) that are accessible for networked servers. This example was created in ConceptDraw DIAGRAM using the Computer and Networks Area of ConceptDraw Solution Park. It shows the hybrid of Storage area network (SAN) and Network Attached Storage (NAS) technologies.
Network Topologies
Network topology is a topological structure of computer network, which can be physical or logical. The physical topology depicts location of different computer network elements such as computers, cables and other devices. The logical topology visually displays network dataflows from one device to another. Sometimes network logical and physical topologies can be the same. ConceptDraw DIAGRAM diagramming and vector drawing software is powerful for drawing network maps and network topologies diagrams of any kinds and complexity thanks to the Computer Network Diagrams solution from the Computer and Networks area. ConceptDraw STORE proposes collection of network icons libraries and a lot of Network Topology Diagram examples, samples and templates which were created at ConceptDraw DIAGRAM software specially for Computer Network Diagrams solution. There are six basic types of the network topologies: Bus, Star, Ring, Mesh, Tree, Fully Connected. You can fast and easy design professional-looking diagram for each of them using the ConceptDraw DIAGRAM tools. There are plenty of web Visio-like diagramming software available. Web based diagrams software can be powerful, but sometimes it is essential to have desktop software. One of the most advanced diagrams tools like Visio for Mac OS is ConceptDraw DIAGRAM app.
Block Diagram
The vector stencils libraries: Block Diagrams, Blocks with Perspective, Callouts, Connectors, Raised Blocks from the solution Block Diagrams contain specific block diagram symbols such as arrows, input/output symbols, start/end symbols, processing symbols, conditional symbols, commenting symbols, callouts, connectors, etc. for ConceptDraw DIAGRAM diagramming and vector drawing software. The Block Diagrams solution is contained in a "Diagrams" area of ConceptDraw Solution Park. Use the libraries from the Block Diagrams solution to draw block diagrams for your business documents, presentations and websites in a few minutes.Software Defined Networking System Overview
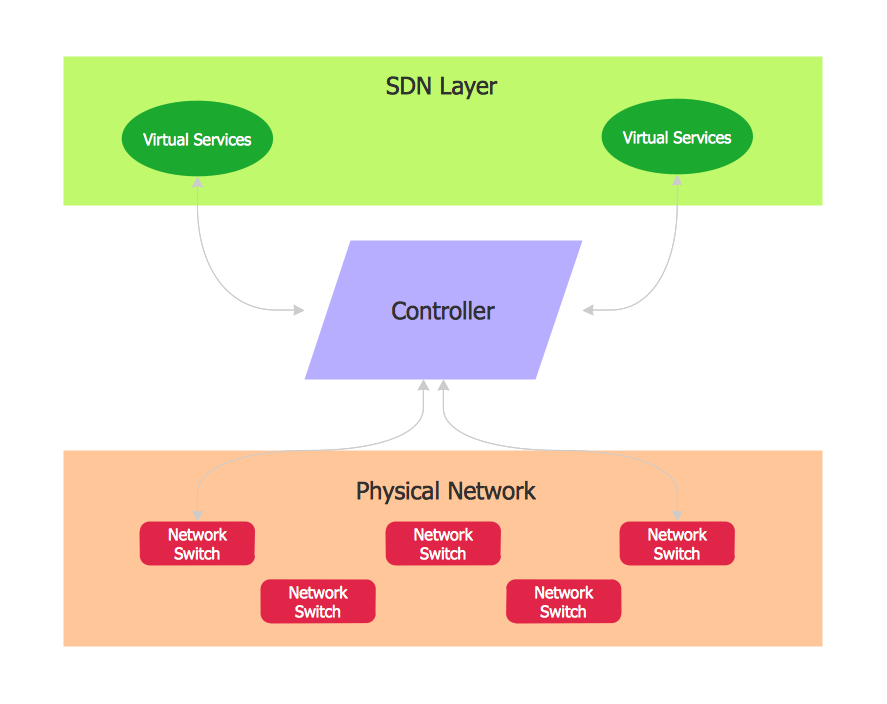
Software-Defined Networking (SDN) is a new powerful concept for decision these problems. SDN proposes to disaggregate the traditional networking stacks that are vertically integrated to customize the network operations for specialized environments and improve network service velocity. On this example you can see the Software-Defined Networking (SDN) diagram that was created in ConceptDraw DIAGRAM using the Computer and Networks Area of ConceptDraw Solution Park.
Star Network Topology
Star is a basic computer network topology in which all nodes (computers and peripheral devices) of the network are connected to the central hub or switch with a point-to-point connection, forming a physical network segment. Such network segment can function separately or as a part of complex network topology. The switch is a server, the peripherals are the clients. The large workload and functions of network management are entrusted on the central computer, all information exchange goes through it, so it must to be obligatory the most powerful. The star network topology is a simple topology for design and implementation. Its advantages are high performance, flexible administration capabilities, simplicity of adding additional nodes and search of faults, the fact that a failure of one workstation doesn't affect the work of entire network. But the failure of central hub will result the failure of whole network or network segment - it's the main disadvantage. Use the ConceptDraw DIAGRAM with Computer and Networks solution to designing Star Network Topology Diagrams fast and easy.
Internet Connectivity. Computer and Network Examples
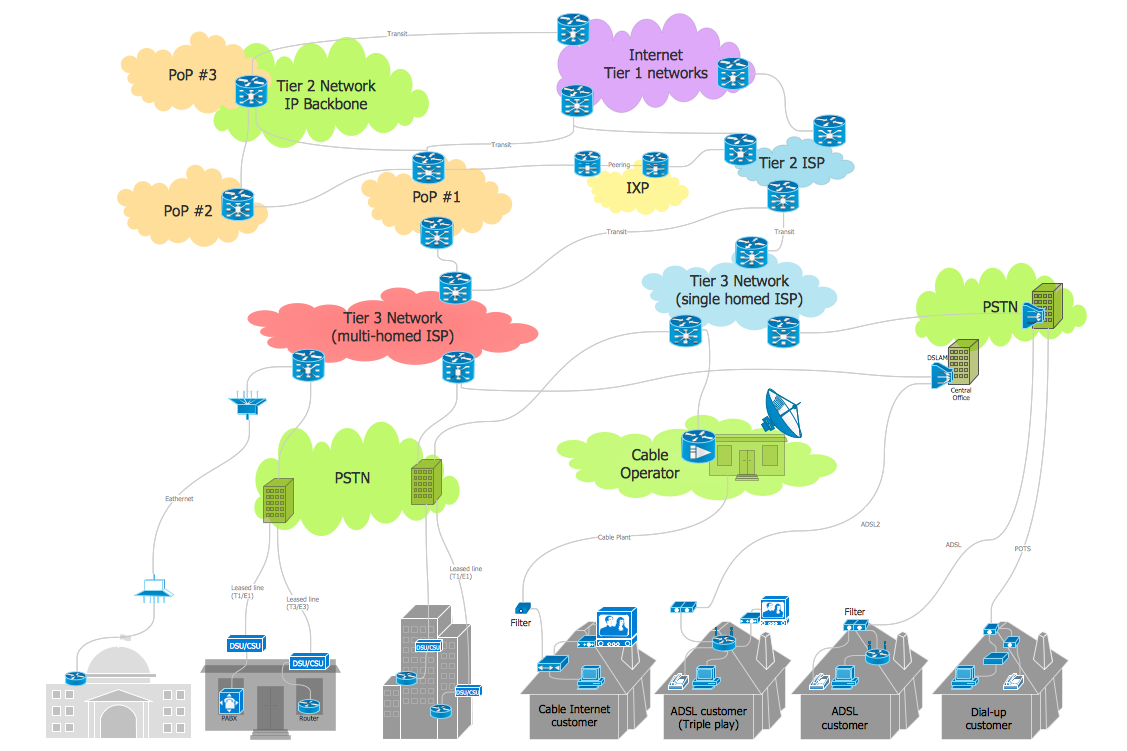
The Internet Connectivity of the computers, mobile devices, computer networks to the Internet enables the users to access the various Internet services. There are many ways and technologies of the connection to the Internet with different data signaling rates: Wireless, Ethernet cable, Optical fiber, Dial-up, DSL, broadband Internet access, etc. This example was created in ConceptDraw DIAGRAM using the Computer and Networks solution from the Computer and Networks area of ConceptDraw Solution Park and shows how the customers connect to ISPs and ISPs connect between the tiers (peering and transit).
Entity Relationship Diagram Software Engineering
Entity Relationship Diagram (aka ER Diagram, E-R Diagram, ERD) is a time-tested and widespread software development and software engineering method for data modeling, illustrating the logical structure of databases and system design. For ERDs construction are used three basic elements: entities, attributes, and relationships. Chen's notation for ERD supposes the use of rectangles (boxes) to represent entities and diamonds to depict relationships between first-class objects. This notation is popular when creating conceptual data models of information systems. Another standardized notation for ER diagrams is Crow's foot notation. ConceptDraw DIAGRAM as a powerful Entity Relationship Diagram software engineering provides the tools of Entity-Relationship Diagram (ERD) solution from Software Development area of ConceptDraw Solution Park for instantly describing databases using ERDs of Crow’s Foot and Chen’s notations. Use the predesigned vector elements for both these notations from 2 libraries included to Entity-Relationship Diagram (ERD) solution.Electrical Symbols, Electrical Diagram Symbols
When drawing Electrical Schematics, Electrical Circuit Diagrams, Power Systems Diagrams, Circuit and Wiring Diagrams, Digital and Analog Logic Schemes, you will obligatory need the electrical symbols and pictograms to represent various electrical and electronic devices, such as resistors, wires, transistors, inductors, batteries, switches, lamps, readouts, amplifiers, repeaters, relays, transmission paths, semiconductors, generators, and many more. Today these symbols are internationally standardized, so the diagrams designed using them are recognizable and comprehensible by specialists from different countries. Electrical Engineering Solution included to ConceptDraw Solution Park provides 26 libraries with 926 commonly used electrical schematic and electrical engineering symbols making the reality the easy drawing of Electrical diagrams, schematics and blueprints. Now you need only a few minutes to create great-looking Electrical diagram, simply choose required electrical design elements from the libraries, drag them on the needed places at the document and connect in a suitable way.WLAN
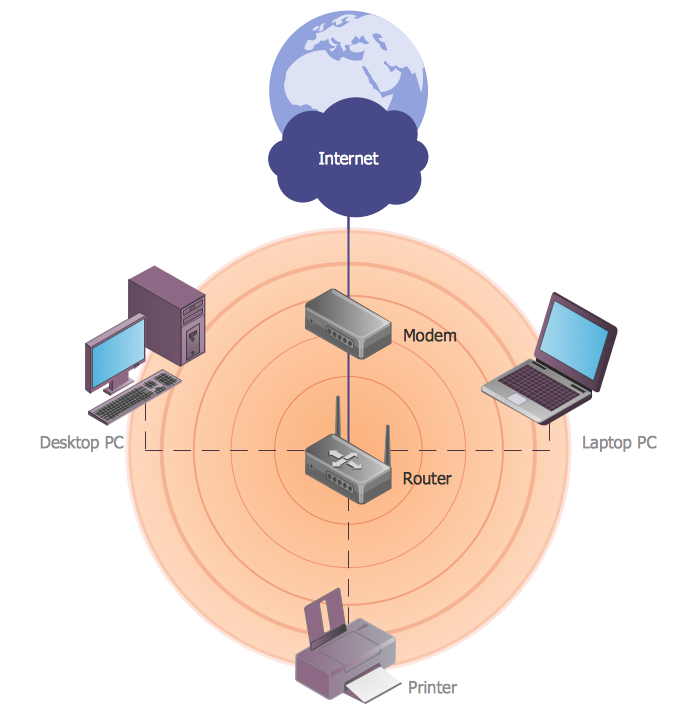
ConceptDraw DIAGRAM diagramming and vector drawing software extended with Wireless Networks Solution gives the ability to its users to create professional looking WLAN schemes and diagrams quick and easy.ERD Symbols and Meanings
Entity Relationship Diagram (ERD) is a popular software engineering tool for database modeling and illustration the logical structure of databases, which uses one of two notations - Chen's or Crow’s Foot. Crow's foot notation is effective when used in software engineering, information engineering, structured systems analysis and design. Each of these notations applies its own set of ERD symbols. Crow's foot diagrams use boxes to represent entities and lines between these boxes to show relationships. Varied shapes at the ends of lines depict the cardinality of a given relationship. Chen's ERD notation is more detailed way to represent entities and relationships. ConceptDraw DIAGRAM application enhanced with all-inclusive Entity-Relationship Diagram (ERD) solution allows design professional ER diagrams with Chen's or Crow’s Foot notation on your choice. It contains the full set of ready-to-use standardized ERD symbols and meanings helpful for quickly drawing, collection of predesigned ERD samples, examples and templates. ConceptDraw Pro is a great alternative to Visio for Mac users as it offers more features and can easily handle the most demanding professional needs.
Network Security Devices
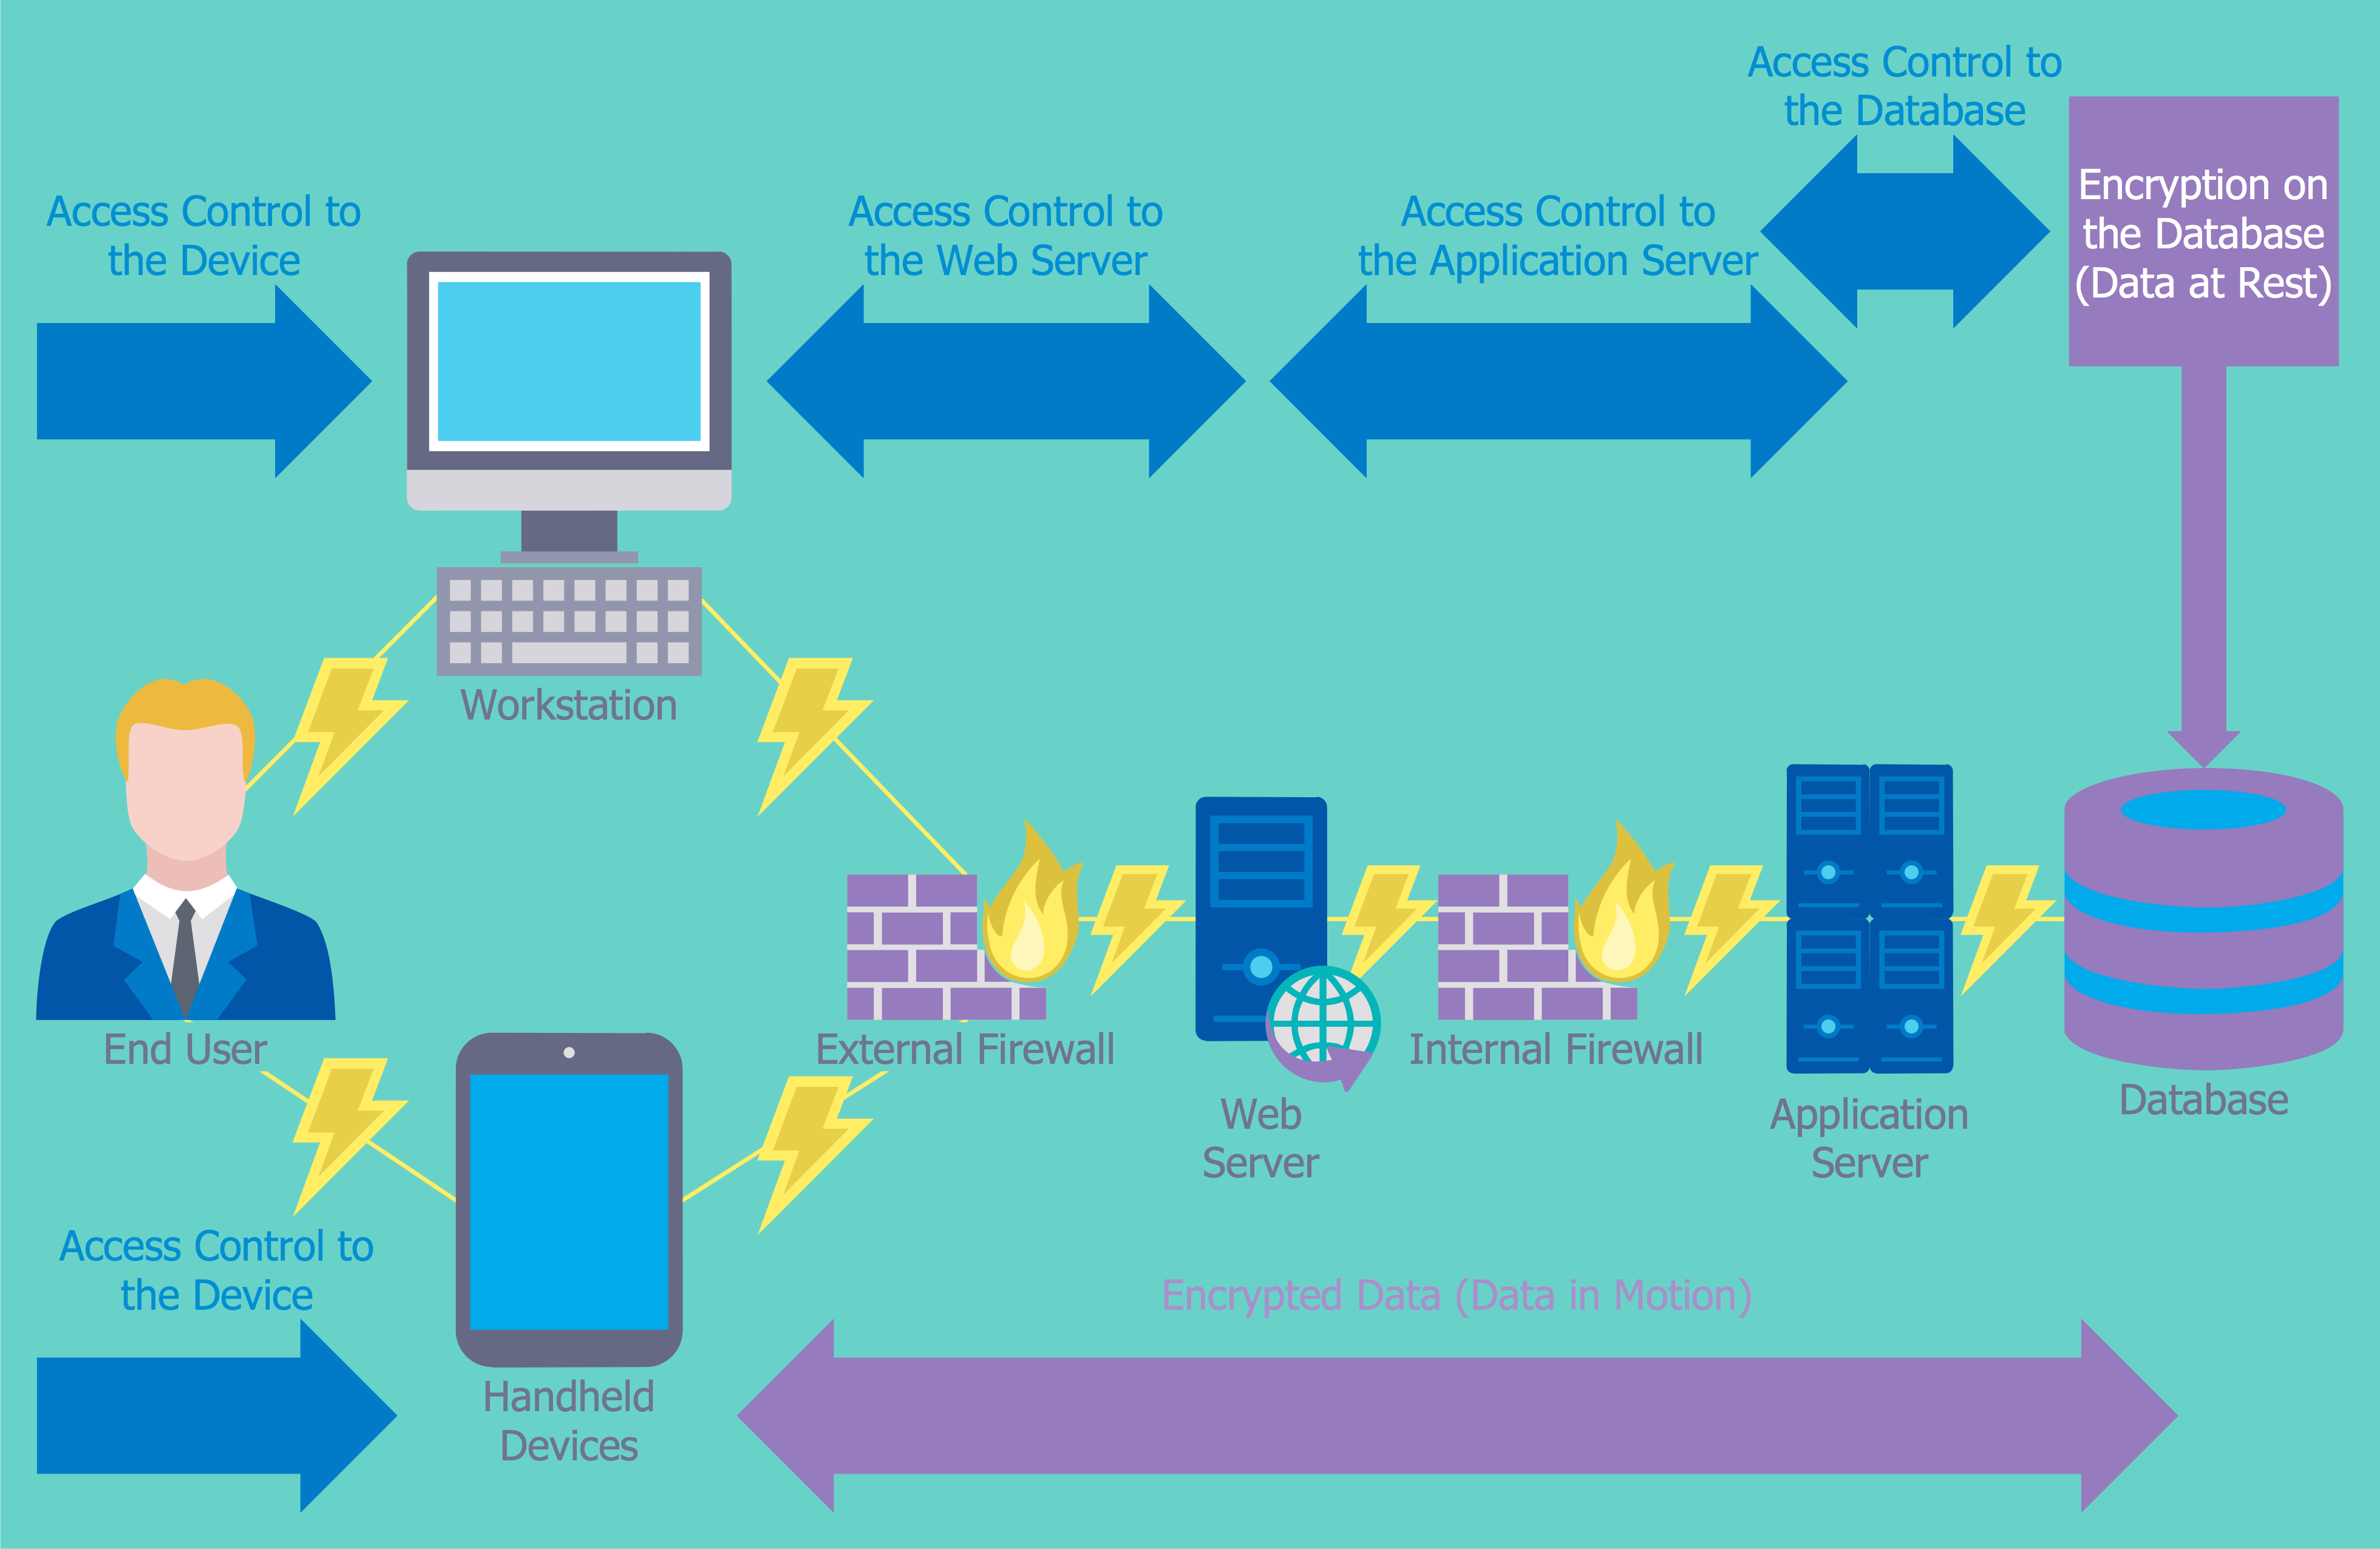
How to describe the necessity of using network security devices and visually illustrate this information? Now, it's very easy thanks to the ConceptDraw DIAGRAM diagramming and vector drawing software extended with Network Security Diagrams Solution from the Computer and Networks Area of ConceptDraw Solution Park.Interactive Voice Response System
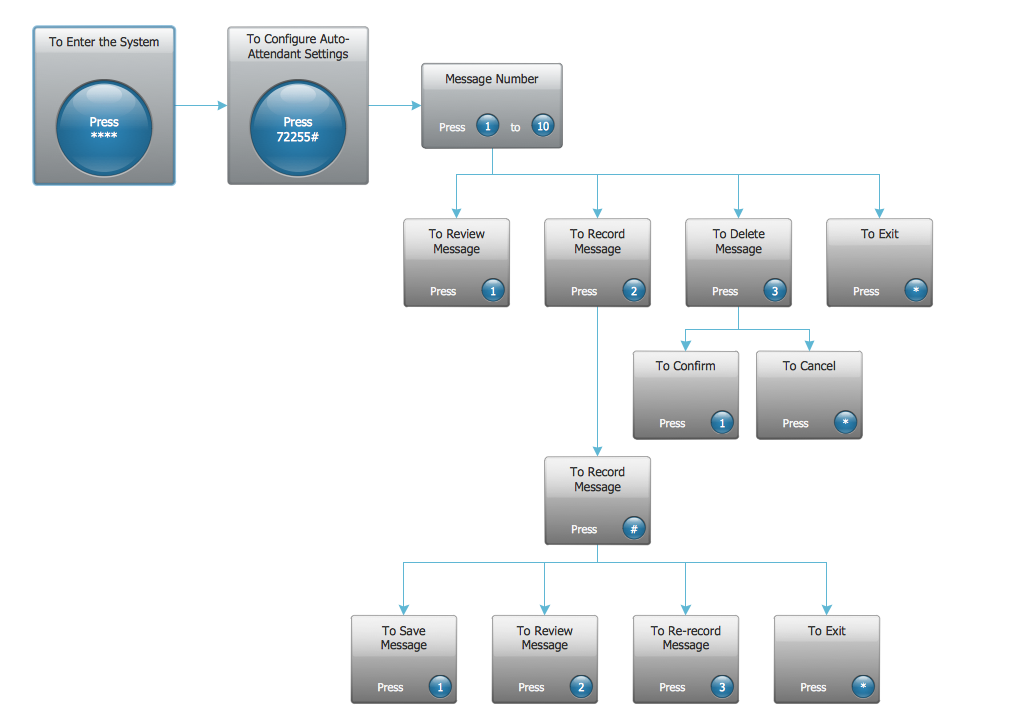
How to represent the Interactive Voice Response System? The commonly used way is to draw the IVR diagram. You can draw it manually in a graphic editor, but ConceptDraw DIAGRAM diagramming and vector drawing software offers you the more effective way - to use the powerful tools of the Interactive Voice Response Diagrams Solution for ConceptDraw Solution Park.How to Dramatically Reduce Drawing Time - New connection modes
The innovative ConceptDraw Arrows10 Technology included in ConceptDraw DIAGRAM is a powerful drawing tool that changes the way diagrams are produced. While making the drawing process easier and faster. This is more than enough versatility to draw any type of diagram with any degree of complexity.Cloud Computing Architecture
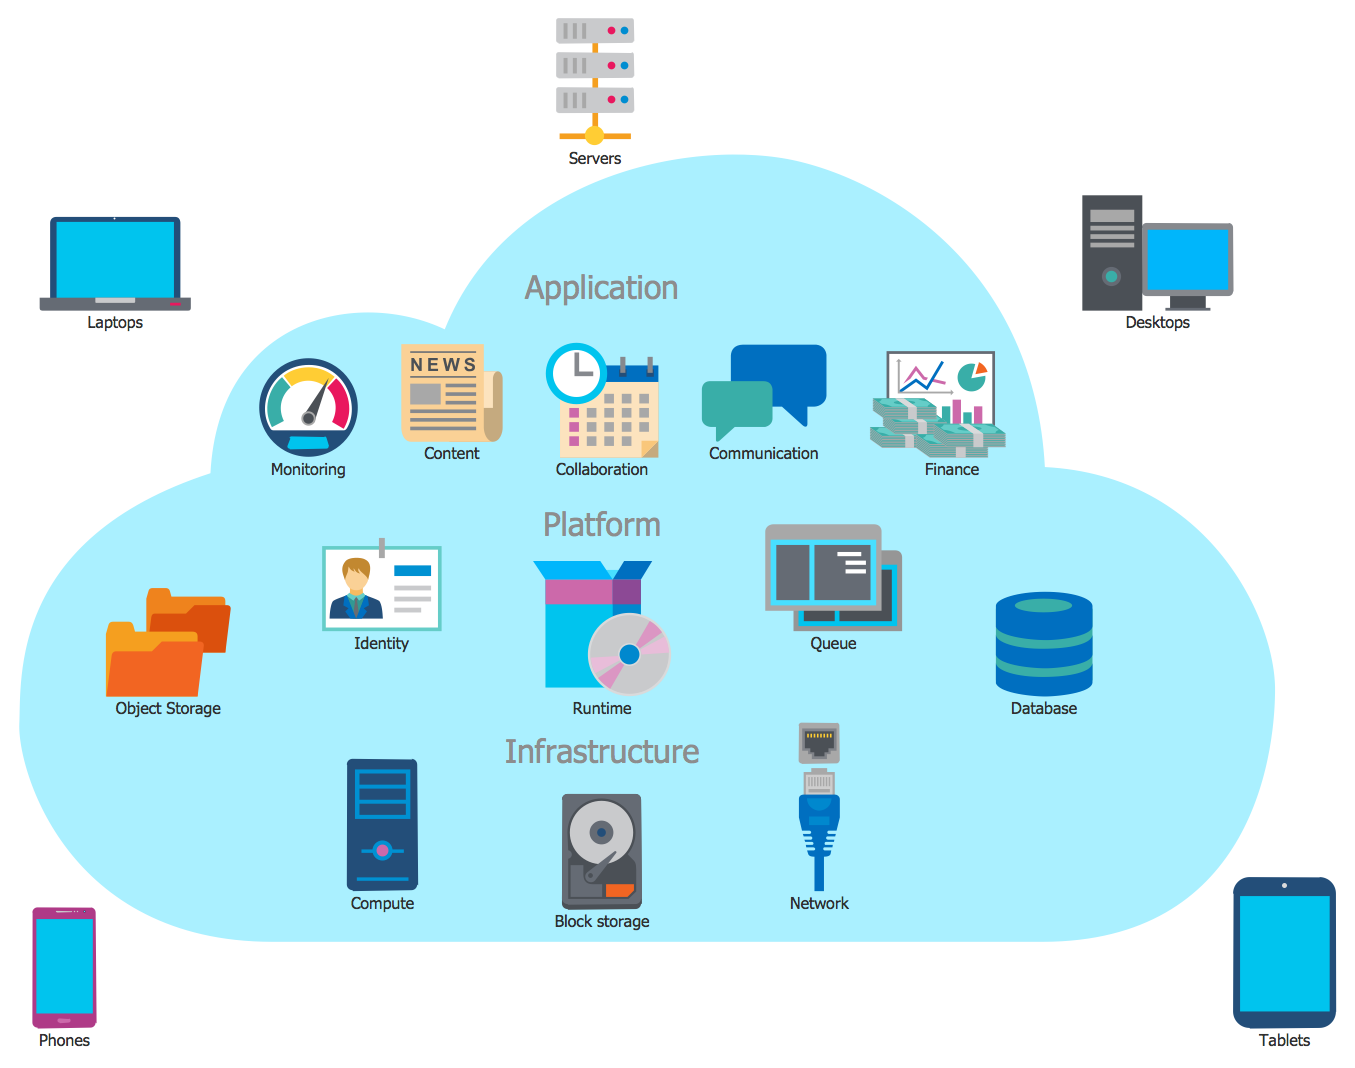
The Cloud Computing Architecture is the structure of the system, which is based on the needs of end-user and includes the set of components and subcomponents required for cloud computing, among them cloud resources, services, middleware, software components, front-end platforms (cloud clients), cloud-based back end platforms (servers, storage), and a network (Internet, Intranet, Intercloud). When designing the Cloud Computing Architecture diagrams, the ConceptDraw DIAGRAM diagramming and vector drawing software advises to turn attention for the powerful Cloud Computing Diagrams solution from the extensive Computers and Network area of ConceptDraw Solution Park.Venn Diagram Examples for Problem Solving. Computer Science. Chomsky Hierarchy
A Venn diagram, sometimes referred to as a set diagram, is a diagramming style used to show all the possible logical relations between a finite amount of sets. In mathematical terms, a set is a collection of distinct objects gathered together into a group, which can then itself be termed as a single object. Venn diagrams represent these objects on a page as circles or ellipses, and their placement in relation to each other describes the relationships between them. The Venn diagram example below visualizes the the class of language inclusions described by the Chomsky hierarchy.- Expalin Wide Area Network Wan And Its Block Diagram
- Network Diagram Examples | Network Diagram Software Physical ...
- Local area network (LAN). Computer and Network Examples | Wide ...
- Logical network topology diagram | Campus Area Networks (CAN ...
- Block Diagram Of Digital Communication System Wikipedia
- Network Layout Floor Plans | Network Layout | Computer Network ...
- Local area network (LAN). Computer and Network Examples ...
- Diagrama de Topologia | Drawing Describing The Communication ...
- Wide area network (WAN) topology. Computer and Network ...
- Wide area network (WAN) topology. Computer and Network ...
- Local area network (LAN). Computer and Network Examples ...
- How To Interpret Network Diagram
- Network Diagram Examples | Wireless broadband network diagram ...
- Network Diagram Examples | Wide area network (WAN) topology ...
- Network Diagram Examples | Cisco LAN fault-tolerance system ...
- Network Diagram Examples | Discuss The Campus Area Network Can
- Telecommunication Network Diagrams | Telecommunication ...
- Local area network (LAN). Computer and Network Examples ...
- Network Diagram Examples | How To use Switches in Network ...

