Address to User Story Question
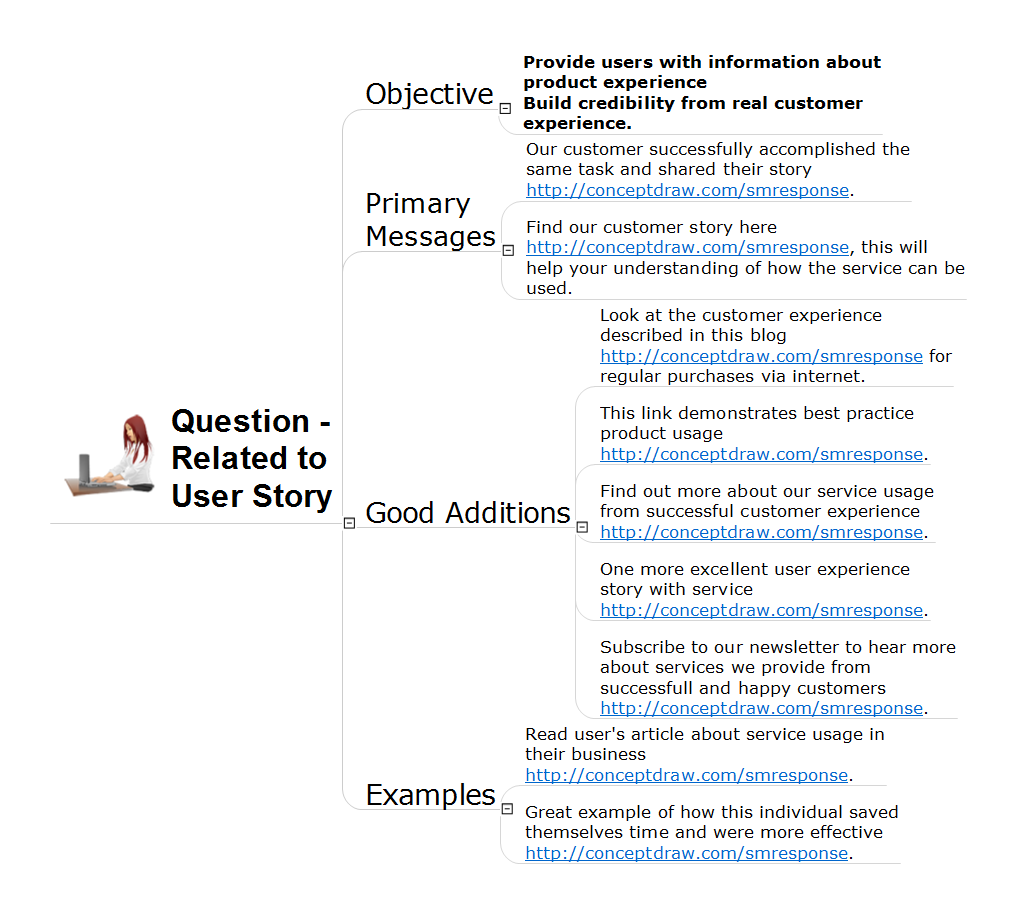
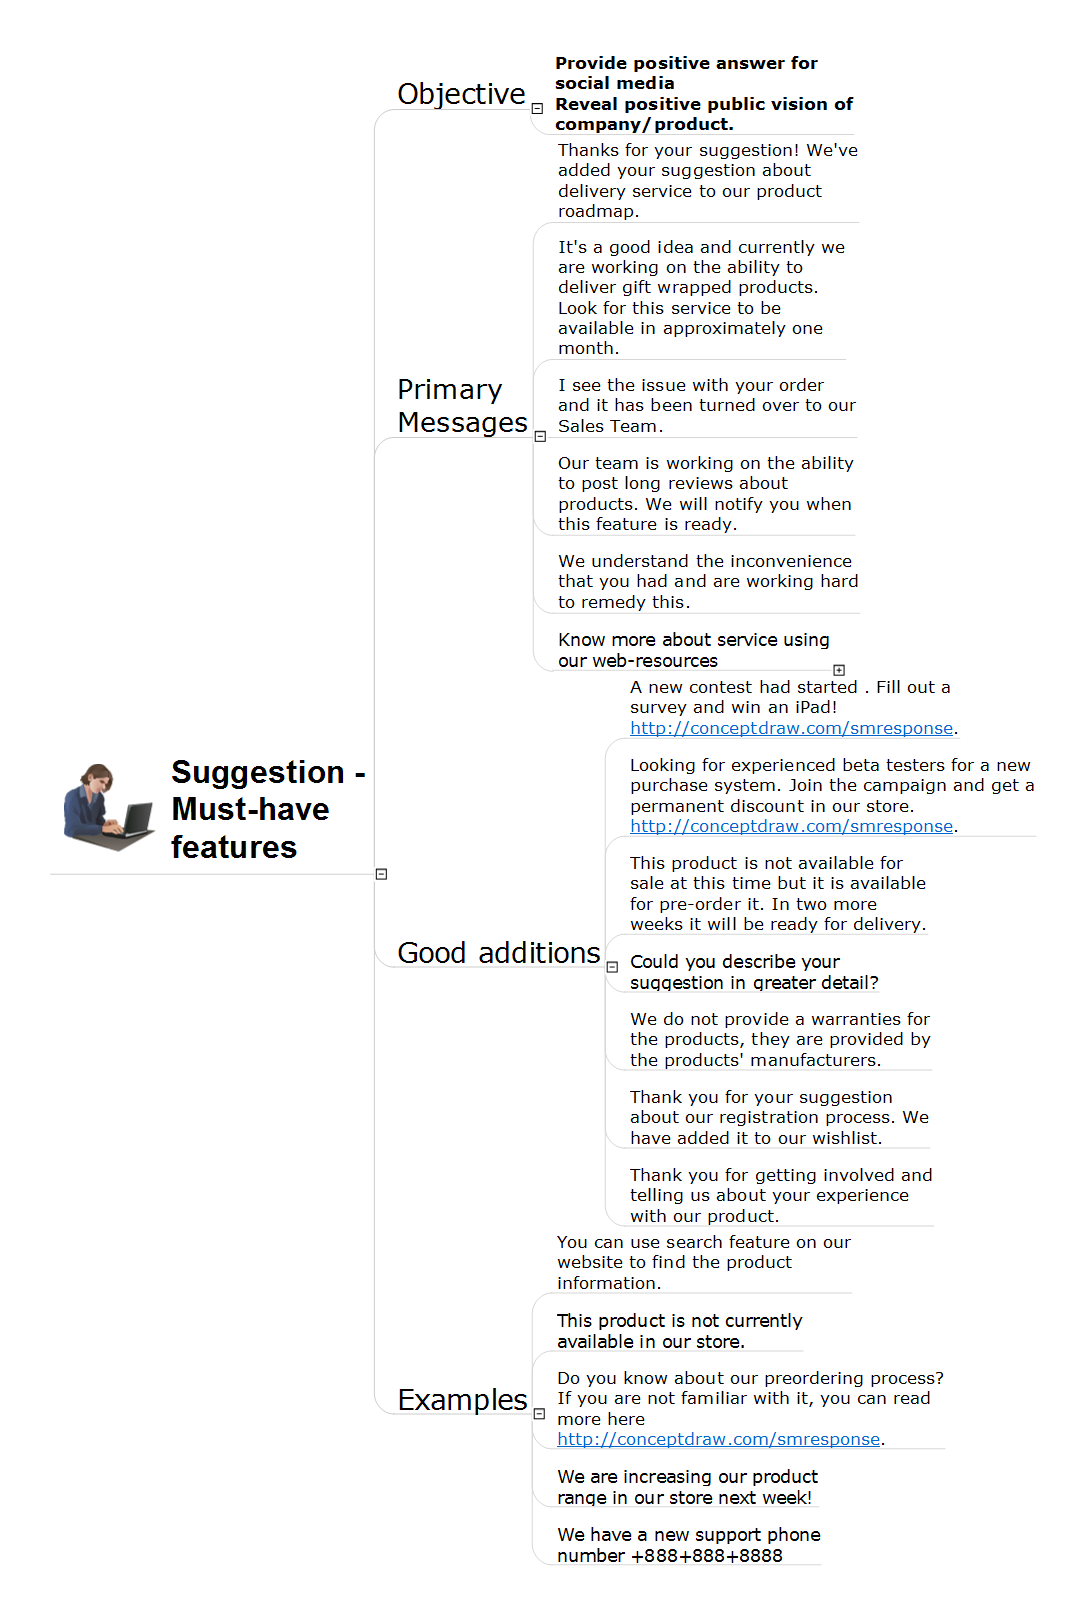
ConceptDraw Solution Park and ConceptDraw MINDMAP software provide a lot of solutions and useful features for their users. All they help users to be successful in business and other fields, to define easily their main objectives and quickly adapt to the changes occurring in a global market, to work collaboratively in a team, to promote the organization to prosperity. The Social Media Response solution also included to ConceptDraw Solution Park helps to organize effectively the process of response for interactions that occur in social media, it lets to respond quickly and professionally to social media mentions, to improve the quality of answers and to minimize the time of responding. ConceptDraw MINDMAP software lets easy consider and answer the questions related to user story from the clients who try to find the advice on product applicability for professional tasks, to discuss them with colleagues and to represent the result as a Mind Map. A given Mind Map example represents the ready to use response phrases for quickest composing and tweeting / posting of response messages.Bank Customer Positive Feedback
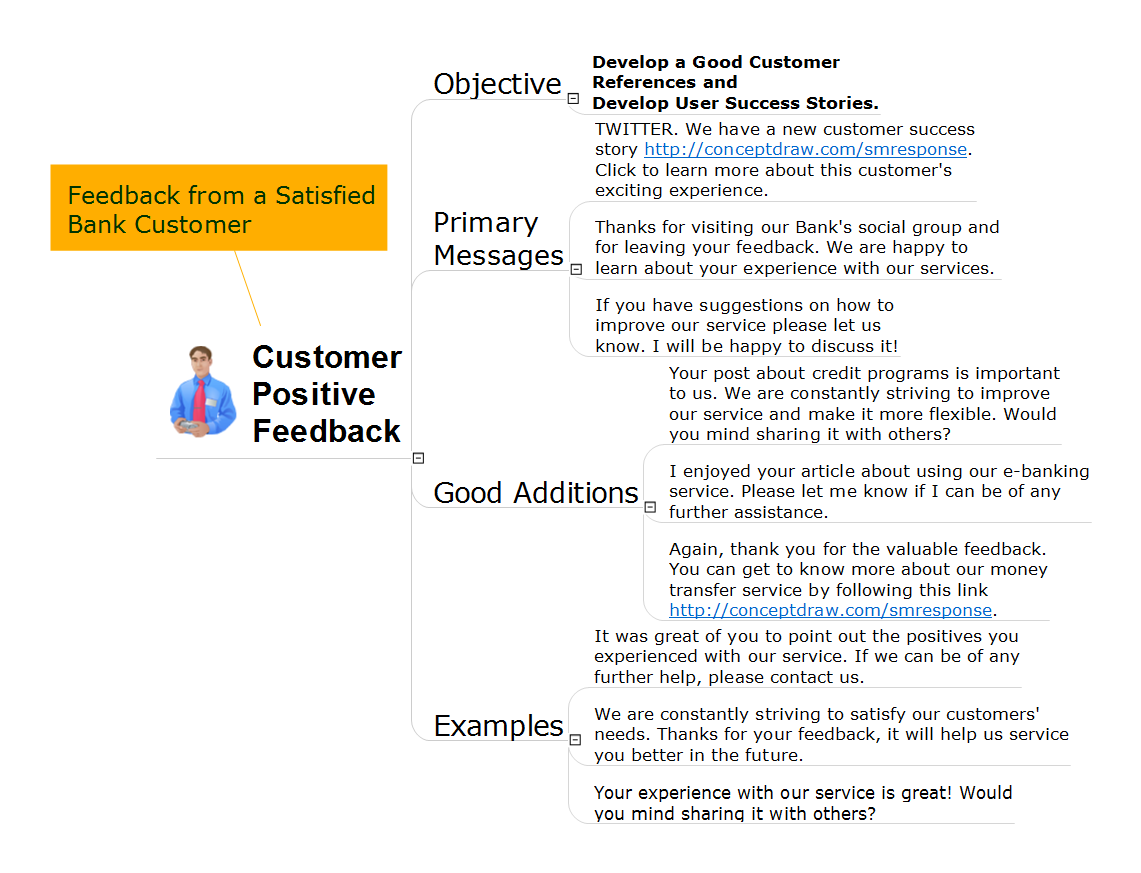
Reviews are the mega-effective sales tool, but as our emotions are multifarious, the customers' reviews and opinions can be also different - positive and negative. It is important to know this fact to correctly react and answer to both. Reviews and feedbacks are ones of the important components of successful development of any business, in finance, banking and other spheres. It is very important to treat seriously to the question of feedbacks, because in modern world when the client thinks about the purchase of any product, in most cases he looks for feedbacks, studies them, herewith reaction and answers of the company's representatives are also always within sight. Reviews allow to learn more about the product and about the company as a whole, to explore the pros and cons of this product or service, to figure out whether you can trust this company and how well it relates to customers after purchase - at the stage of questions, warranty, repair, etc. This action Mind Map created in ConceptDraw MINDMAP depicts how to answer correctly on the customer's positive feedbacks and helps to develop the user success stories and to receive a lot of good customer references.Positive Customer Feedback
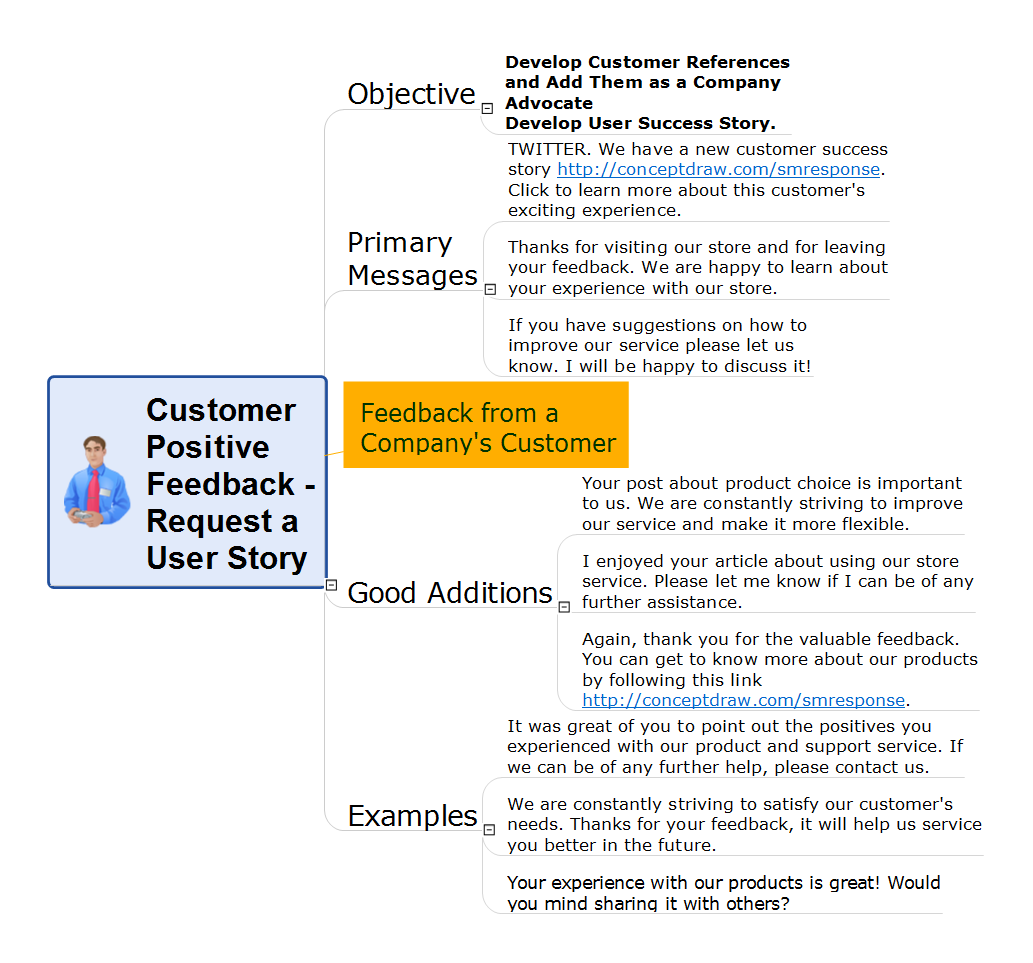
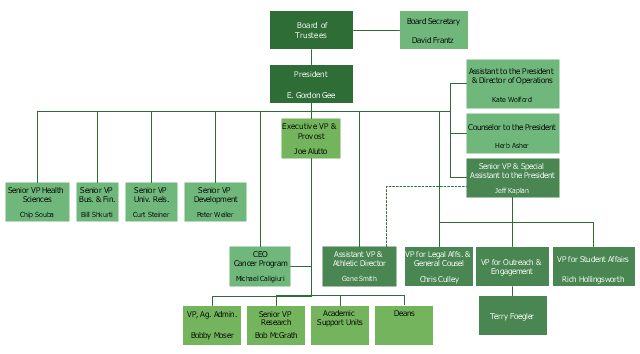
Customer feedback on products is a real engine of sales. It is an important component for any business and a great way to look at your business with buyers' eyes, moreover the positive customer reviews are important as well as the negative. The last help to identify the deficiencies negatively affecting the business, to take the necessary actions for their elimination and create a product really need for buyers. Work with social media and customer reviews is an important component of any marketing strategy. The more users write reviews, the higher is the recognition of brand and interest for it. Currently many buyers before buying anything, carefully study the reviews of other buyers. Of course, it is not enough only reviews for business success, but they undoubtedly play a big role. Positive reviews are able to dispel the doubts that keep from the making a purchase, help to make the right choice and even motivate the customers to spend more than originally anticipated. Actively use customer feedback for successful development your business. This action Mind Map created in ConceptDraw MINDMAP contains ready to use response phrases that help correctly respond to the positive customer feedback, quick compose and post / tweet response messages.This example is based on the organizational chart from the Ohio State University website. [osu.edu/ vpsearch/ images/ University_ Org_ Chart.png]
"The Ohio State University, a multi-campus land grant institution with an international presence, is a world-class public research university and the leading comprehensive teaching and research institution in the state, Ohio's flagship university. Ohio State provides a distinctive educational experience for students and pursues cutting-edge interdisciplinary research that brings together scholars from diverse disciplines to solve key problems in society.
One of the University's core values is to "ignite a lifelong love of learning" in students. Ohio State students benefit from a scholarly environment in which research inspires and informs teaching.
The Vice President for Student Life provides vision, leadership, and strategic direction to the Office of Student Life, a comprehensive unit dedicated to supporting the educational mission of the University and promoting the best possible overall experience for the diverse student body of approximately 60,000. The Office of Student Life supports every aspect of Ohio State students experience. Its scope includes housing, campus dining, disability services, the multicultural center, counseling and health services, student organizations and leadership development, and other related operations." [osu.edu/ vpsearch/ ]
The organizational chart example "University leadership" was created using the ConceptDraw PRO diagramming and vector drawing software extended with the Organizational Charts solution from the Management area of ConceptDraw Solution Park.
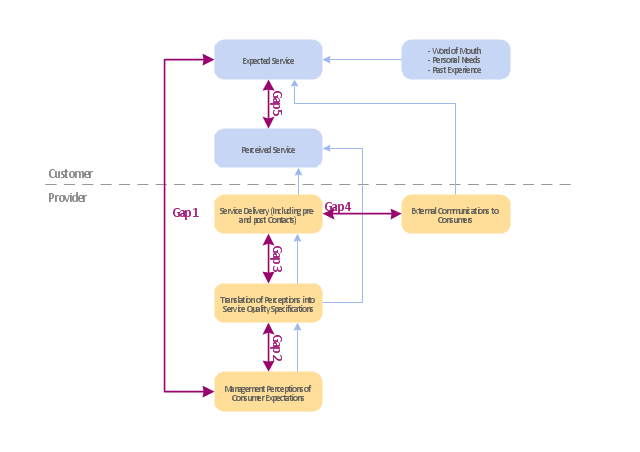
"Dimensions of service quality.
A customer's expectation of a particular service is determined by factors such as recommendations, personal needs and past experiences. The expected service and the perceived service sometimes may not be equal, thus leaving a gap. The service quality model or the ‘GAP model’ developed by a group of authors- Parasuraman, Zeithaml and Berry at Texas and North Carolina in 1985 , highlights the main requirements for delivering high service quality. It identifies five ‘gaps’ that cause unsuccessful delivery. Customers generally have a tendency to compare the service they 'experience' with the service they 'expect' . If the experience does not match the expectation , there arises a gap. Ten determinants that may influence the appearance of a gap were described by Parasuraman, Zeithaml and Berry. in the SERVQUAL model: reliability, responsiveness, competence, access, courtesy, communication, credibility, security, understanding the customer and tangibles.
Later, the determinants were reduced to five: tangibles; reliability; responsiveness; service assurance and empathy in the so called RATER model." [Service quality. Wikipedia]
The block diagram example "Gap model of service quality" was created using the ConceptDraw PRO diagramming and vector drawing software extended with the Block Diagrams solution from the area "What is a Diagram" of ConceptDraw Solution Park.
Total Quality Management Definition
The Total Quality Management Diagram solution helps you and your organization visualize business and industrial processes. Create Total Quality Management diagrams for business process with ConceptDraw software.Must Have Suggestion
The increasing of sales directly depends from the improvement and perfection of the product and from adding new features must-have according to the customers' opinion. In this regard, it is important to have constant feedback with customers, to analyze their questions and make conclusions, to conduct various surveys, to maintain statistics, to monitor changes and market's improvement in a given segment. Heed to customers feedback, respond quickly to requests, consider proposals for improvements to develop your business, to increase the client orientation and competitiveness. The competition makes business more interesting and effective, that's why it is important to analyze the market, as well as the successes and suggestions of other companies in this field. In many cases detailed analysis will help to detect the trends and understand what features are in demand at the moment. This is very important, because timely addition of relevant features and effective possibilities in many cases helps to dramatically increase the popularity of the product and accordingly the volume of its sales. Don't be afraid to follow the expectations of your customers and surprise them also. This action Mind Map helps correctly respond to feature suggestions made by customers and for requirements related to must-have features. The example contains ready to use response phrases.
 Circle-Spoke Diagrams
Examples of subject areas that are well suited to this approach are marketing, business, products promotion, process modeling, market, resource, time, and cost analysis. Circle-Spoke Diagrams are successfully used in presentations, conferences, management documents, magazines, reportages, reviews, reports, TV, and social media.
 Project Management Area
Project Management area provides Toolbox solutions to support solving issues related to planning, tracking, milestones, events, resource usage, and other typical project management functions.
The vector stencils library "Scrum workflow" contains 39 icons.
Use this clipart set to design your agile software development diagrams and flowcharts with ConceptDraw PRO software.
"A sprint (or iteration) is the basic unit of development in scrum. The sprint is a timeboxed effort; that is, it is restricted to a specific duration. The duration is fixed in advance for each sprint and is normally between one week and one month, with two weeks being the most common.
Each sprint starts with a sprint planning event that aims to define a sprint backlog, identify the work for the sprint, and make an estimated commitment for the sprint goal. Each sprint ends with a sprint review and sprint retrospective, that reviews progress to show to stakeholders and identify lessons and improvements for the next sprints.
Scrum emphasizes working product at the end of the sprint that is really done. In the case of software, this likely includes that the software has been integrated, fully tested, end-user documented, and is potentially shippable." [Scrum (software development). Wikipedia]
The clip art sample "Design elements - Scrum workflow" is included in the Scrum solution from the Project Management area of ConceptDraw Solution Park.
Used Solutions
Cross-functional flowchart Templates portrait, metric
ConceptDraw Cross-Functional Flowchart templates include a mix of portrait and landscape metric layouts of the following process diagram types: - Cross-Functional Horizontal - Cross-Functional Vertical - Opportunity Flowchart - Swim Lane MapHelpDesk
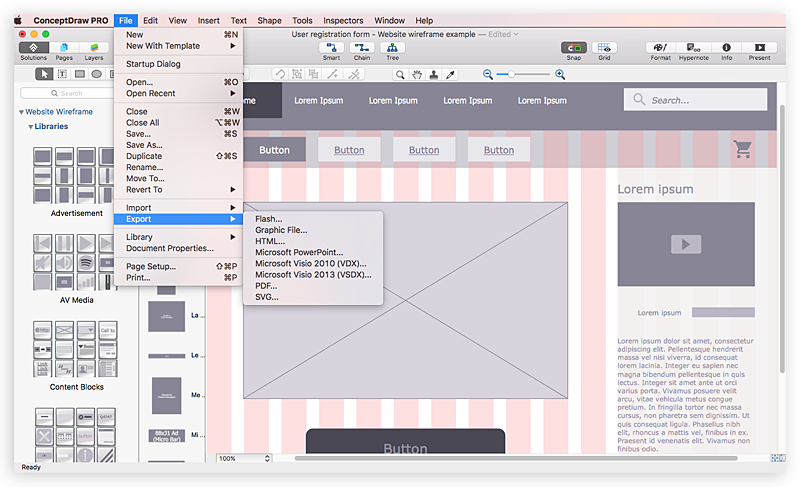
How to Develop Website Wireframes Using ConceptDraw PRO
Website design is a rather complicated process. The development of a website wireframe is an important step in any screen design process. The first step of this process before coding can start, web designer creates a website wireframe — a mock-up for what will be displayed on the screen when navigating through the web site pages. A wireframe design always includes three components:Information design, navigation design and interface design. The configuration of these components depends on the business model of the website. The Website Wireframing tools provided with ConceptDraw Website Wireframe solution helps to define the information hierarchy of website design, making it easier for web-developers to plan the layout according to how a site visitor have to process the information.Cross-Functional Flowchart
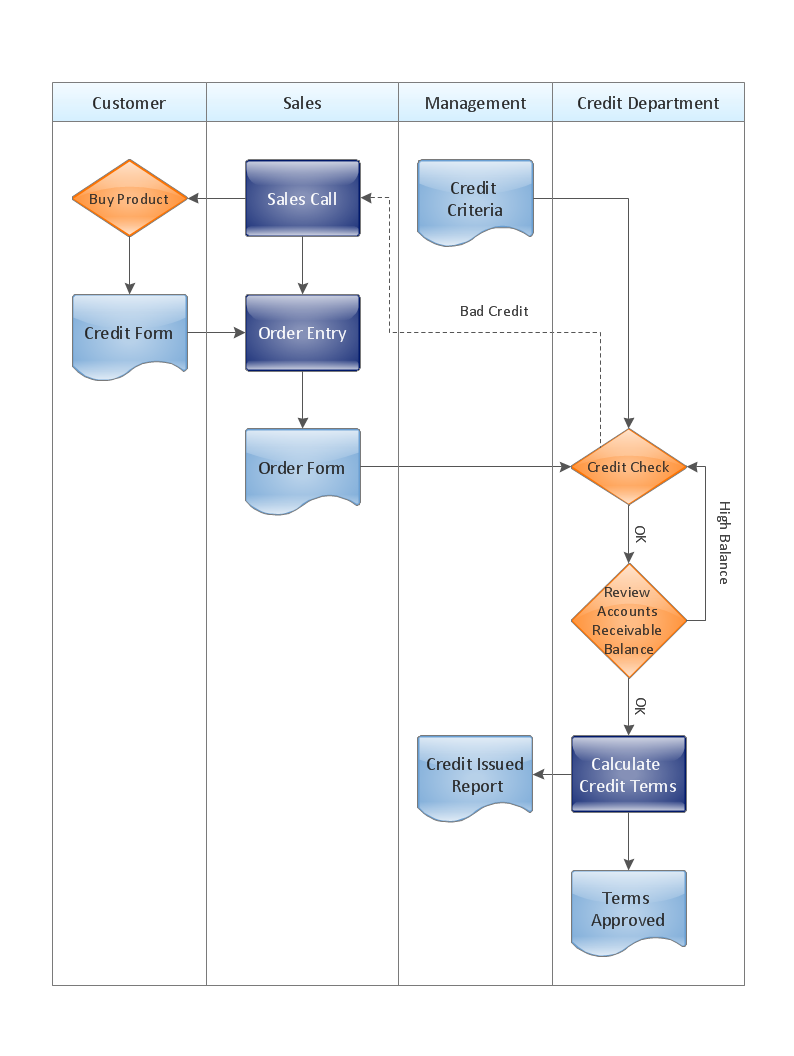
Use of Cross-Functional Flowchart is a clear way of showing each team member’s responsibilities and how processes get shared or transferred between different responsible people, teams and departments. Use the best flowchart maker ConceptDraw PRO with a range of standardized cross-functional flowchart symbols to create the Cross-Functional Flowcharts simply and to visualize the relationship between a business process and the functional units responsible for that process. To draw the most quickly Cross-Functional Flowcharts, Cross Functional Process Maps, or Cross Functional Process Flow Diagrams, start with a Cross-functional flowchart samples and templates from ConceptDraw Solution Park. The ConceptDraw Arrows10 and RapidDraw technologies will be also useful for you in drawing. ConceptDraw PRO supports designing both types - horizontal and vertical Cross-functional flowcharts. A vertical layout makes the accents mainly on the functional units while a horizontal layout - on the process. If you need a Visio alternative in Mac OS X, try ConceptDraw PRO. Its interface is very intuitive and it’s actually much easier to use than Visio, yet somehow it’s just as powerful if not more so. ConceptDraw PRO performs professional quality work and seamless Visio interaction.
Vertical Cross Functional Flowchart
ConceptDraw PRO is a powerful tool that helps you create professional looking cross-functional flowcharts with the well-designed objects. ConceptDraw PRO - Drawing Software for Vertical Cross Functional Flowchart. ConceptDraw allows you to focus on work, not the drawing process. ConceptDraw Arrows10 Technology allows to draw connectors with smart behavior that gives flexibility to you during work process.- Pie Chart Word Template. Pie Chart Examples | Pyramid Chart ...
- Block Diagram For A Service
- Chart Maker for Presentations | Basic Diagramming | Chart ...
- How to Draw a Histogram in ConceptDraw PRO | Chart Examples ...
- Event-driven Process Chain Diagrams | Audit Flowcharts | Line ...
- Create Organizational Chart | Organizational chart - University ...
- Pyramid Diagram and Pyramid Chart | Basic Diagramming | Chart ...
- Block diagram - Gap model of service quality | Block Diagram ...
- Block diagram - Gap model of service quality | Process Flowchart ...
- Based On Your Experience With A Bank Atm Draw An Activity
- Software In Management With Experience And Digram
- Bar Chart Software | Bar Graphs | Rainfall Bar Chart | Online Double ...
- Organizational chart - University leadership | Organizational chart ...
- Line Graph Examples For Students
- Pie Chart Examples and Templates | Chart Maker for Presentations ...
- Total Quality Management TQM Diagrams | TQM Diagram Tool ...
- How to Draw the Different Types of Pie Charts | Pie Chart Software ...
- Block diagram - Gap model of service quality | Rater Model
- Basic Diagramming | Line Graph Charting Software | Create Graphs ...
