ConceptDraw Arrows10 Technology
Connecting objects manually in ConceptDraw PRO is a snap: - points; - Connecting groups of objects; - Auto-routing; - Connectors text; - Snap to Guides ; - Quick.Cross-Functional Process Map Template
When you need a drawing software to create a professional looking cross-functional charts, ConceptDraw with its Arrows10 Technology - is more than enough versatility to draw any type of diagram with any degree of complexity. Use templates with process maps, diagrams, charts to get the drawing in minutes.Cross-functional flowchart landscape, U.S. units
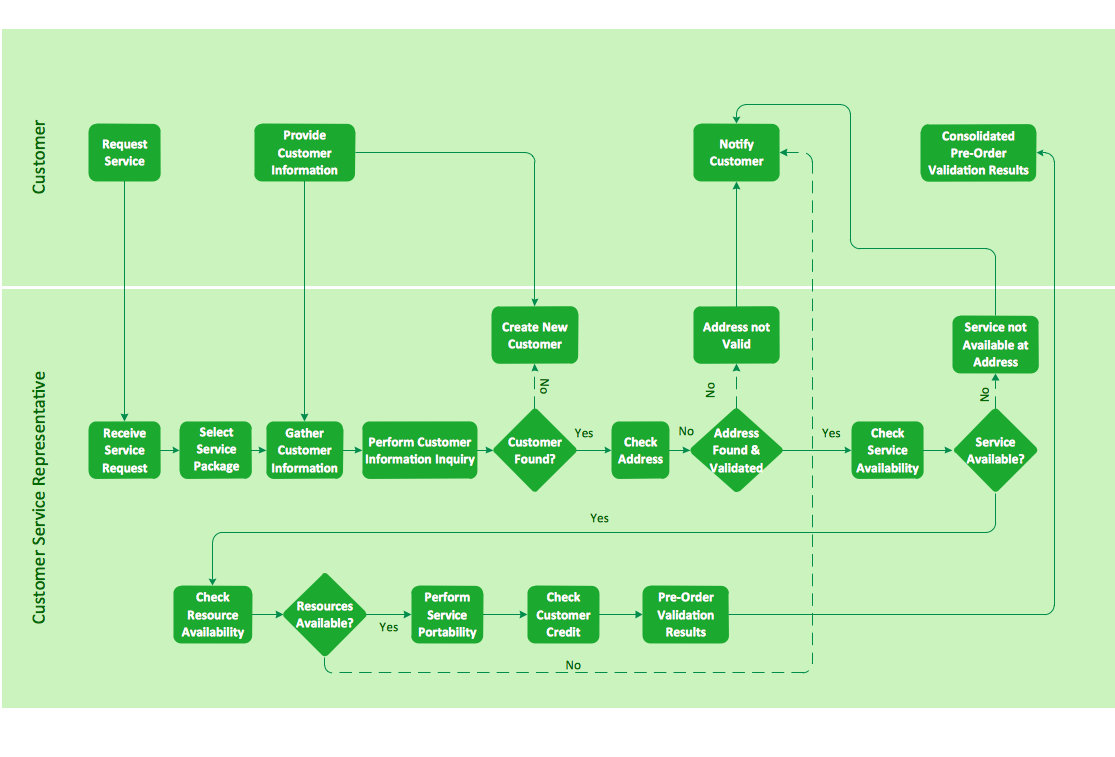
In Cross-Functional Flowchart first step is to determine how many lanes you want to represent and what the lane titles will be. The choice of vertical or horizontal swim lanes landscape comes down to personal choice or just plain “what fits best”. With ConceptDraw, we make that simple by including different swim lanes templates. Professional looking examples and templates of Swimlane Flowchart which help you create Cross Functional Flowcharts rapidly.Cross Functional Flowchart for Business Process Mapping
Start your business process mapping with conceptDraw PRO and its Arrows10 Technology. Creating a process map, also called a flowchart, is a major component of Six Sigma process management and improvement. Use Cross-Functional Flowchart drawing software for business process mapping (BPM). Use a variety of drawing tools, smart connectors and shape libraries to create flowcharts of complex processes, procedures and information exchange. Define and document basic work and data flows, financial, production and quality management processes to increase efficiency of you business.
 Software Development Area
Solutions from the Software Development Area of ConceptDraw Solution Park collect templates, samples and libraries of vector stencils for drawing the software engineering diagrams and user interface design prototypes.
- Flowchart Definition | Basic Flowchart Symbols and Meaning | Cross ...
- Total Quality Management Definition | Cross- Functional Flowchart ...
- TQM Diagram Example | Probability Quality Control Tools | TQM ...
- Explain Quality Function Deployment With Diagram
- Deployment Chart Software | Deployment chart - Template | Quality ...
- Which Aid Diagram Explain Software
- Explain Software With The Help Of Diagrams
- Total Quality Management Definition
- Explain Software With A Help Of A Diagram
- Process Flowchart | Total Quality Management Value | Swim Lane ...
- Process Flowchart | Total Quality Management Definition | Total ...
- Process Flowchart | Flowchart Definition | Cross- Functional ...
- Using Diagram Explain The Concept Of Value Chain
- Process Flowchart | TQM Software — Build Professional TQM ...
- Flowchart Definition | Basic Flowchart Symbols and Meaning ...
- Flowchart Definition | Cross- Functional Flowchart | Basic Flowchart ...
- Process Flowchart | Basic Flowchart Symbols and Meaning | Total ...
- Process Flowchart | How to Draw an Organization Chart | BPR ...
- Draw The Flow Chart In The Tools For Quality Control And Explain
- Total Quality Management Value | How to Create an Enterprise ...


