MS Visio Look a Like Diagrams
No need for any special drawing skills to create professional looking diagrams outside of your knowledge base. ConceptDraw DIAGRAM takes care of the technical details, allowing you to focus on your job, not the drawing. ConceptDraw DIAGRAM delivers full-functioned alternative to MS Visio. ConceptDraw DIAGRAM supports import of Visio files. ConceptDraw DIAGRAM supports flowcharting, swimlane, orgchart, project chart, mind map, decision tree, cause and effect, charts and graphs, and many other diagram types.Components of ER Diagram
Entity-Relationship model gives the possibility to visually describe a database using the components of ER Diagram, entity relationship stencils, relationship symbols, work flow shapes. ER-diagram lets represent the data or entities, attributes of these entities and relationships between them, using standardized Crow’s Foot notation icons or Chen’s notation icons. An entity is an object of the real world, it can exist independently and has the instances which differ in attribute values (properties). The attributes give an unambiguous (uniquely) identification for the instance and are called the primary key, this key can be composite and combine several attributes. ConceptDraw DIAGRAM is a professional software available with Entity-Relationship Diagram (ERD) solution from Software Development area that lets create ERDs for various database systems, using Crow’s Foot and Chen’s notations. It is invaluable tool for software engineers and developers, it supports ODBC-compatible databases (Oracle, MySQL, MS Access, MS SQL, InterBase, Firebird and others).Visio Files and ConceptDraw
Visio Files and ConceptDraw. ConceptDraw DIAGRAM is compatible with MS Visio.VDX formatted files.VDX is Visio’s open XML file format, and it can be easily imported and exported by ConceptDraw DIAGRAM.HelpDesk
How to Draw a Block Diagram
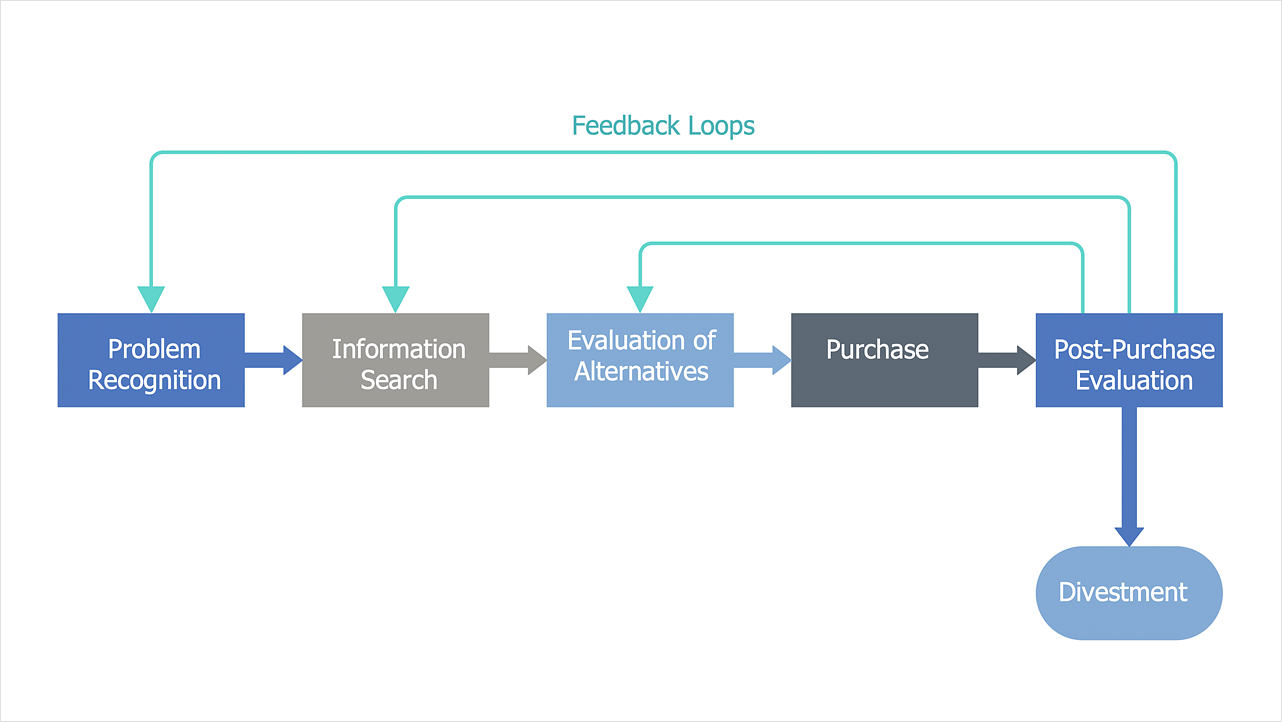
Block diagram is a simple chart that use blocks to show some elements or activities, and connectors that show the relationship between neighboring blocks. They are commonly simple, giving an overview of a process without necessarily going into the specifics of implementation. Block diagrams are commonly used to depict a general description of a system and its activity. A most known sample of a block diagram is a flow chart, used in many types of business as a common method of representing repeated processes. Easy and a simple creation, a number of objects and connectors make the block diagram a many-sided tool for various industries. The ability to make block diagrams is delivered by the ConceptDraw Block Diagrams solution.HelpDesk
How To Make a Crow's Foot ER Diagram
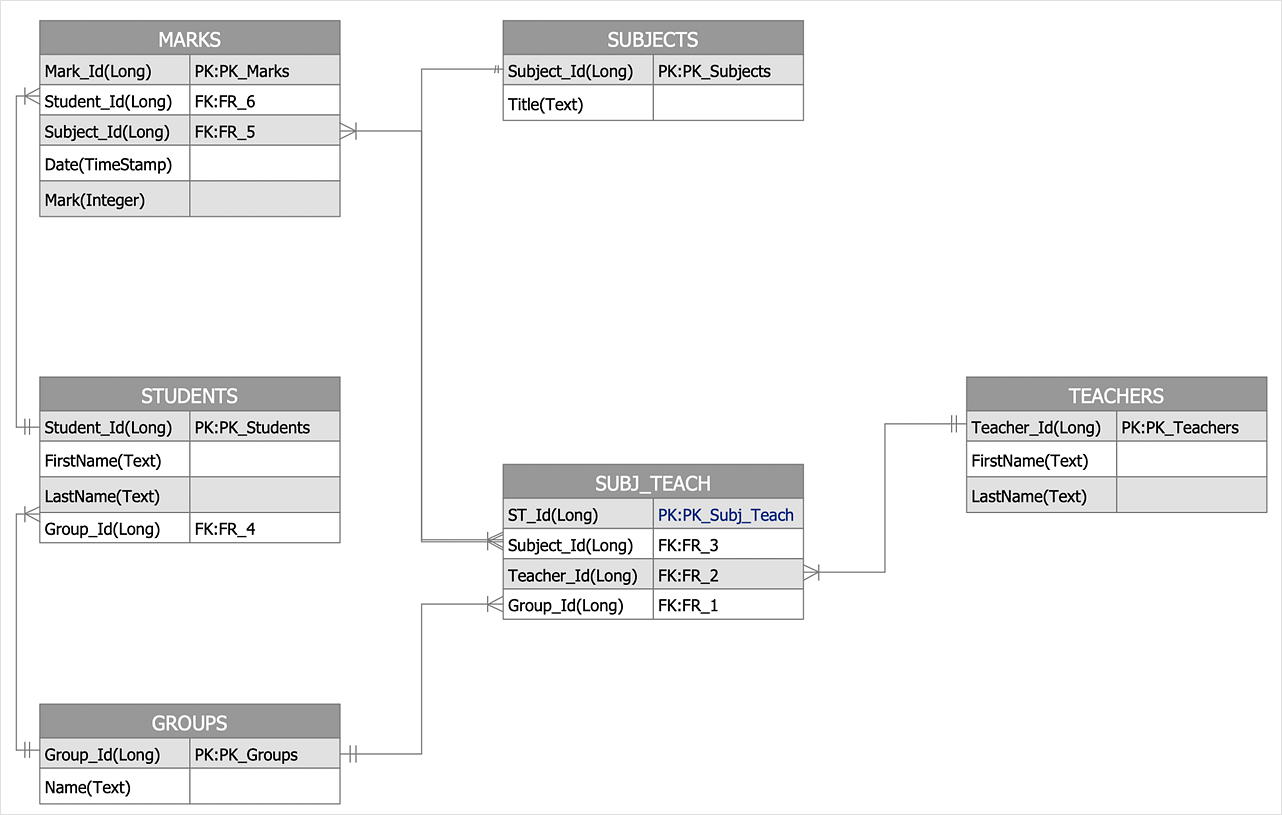
The Crow's Foot ERD notation is often used in software engineering and database design. The originator of Crow’s Foot notation was Gordon Everest, who offered the idea of how to visually represent the different types of relationships that can exist between objects in an entity relationship diagram (ERD). The Crow’s Foot notation is often used in ER models to how a particular table data can reference data in other tables within a database. The free Crow's Foot Notation solution for ConceptDraw DIAGRAM offers a complete vector stencil library containing full standardized symbols of Crow's Foot notation.HelpDesk
How to Create an Entity-Relationship Diagram
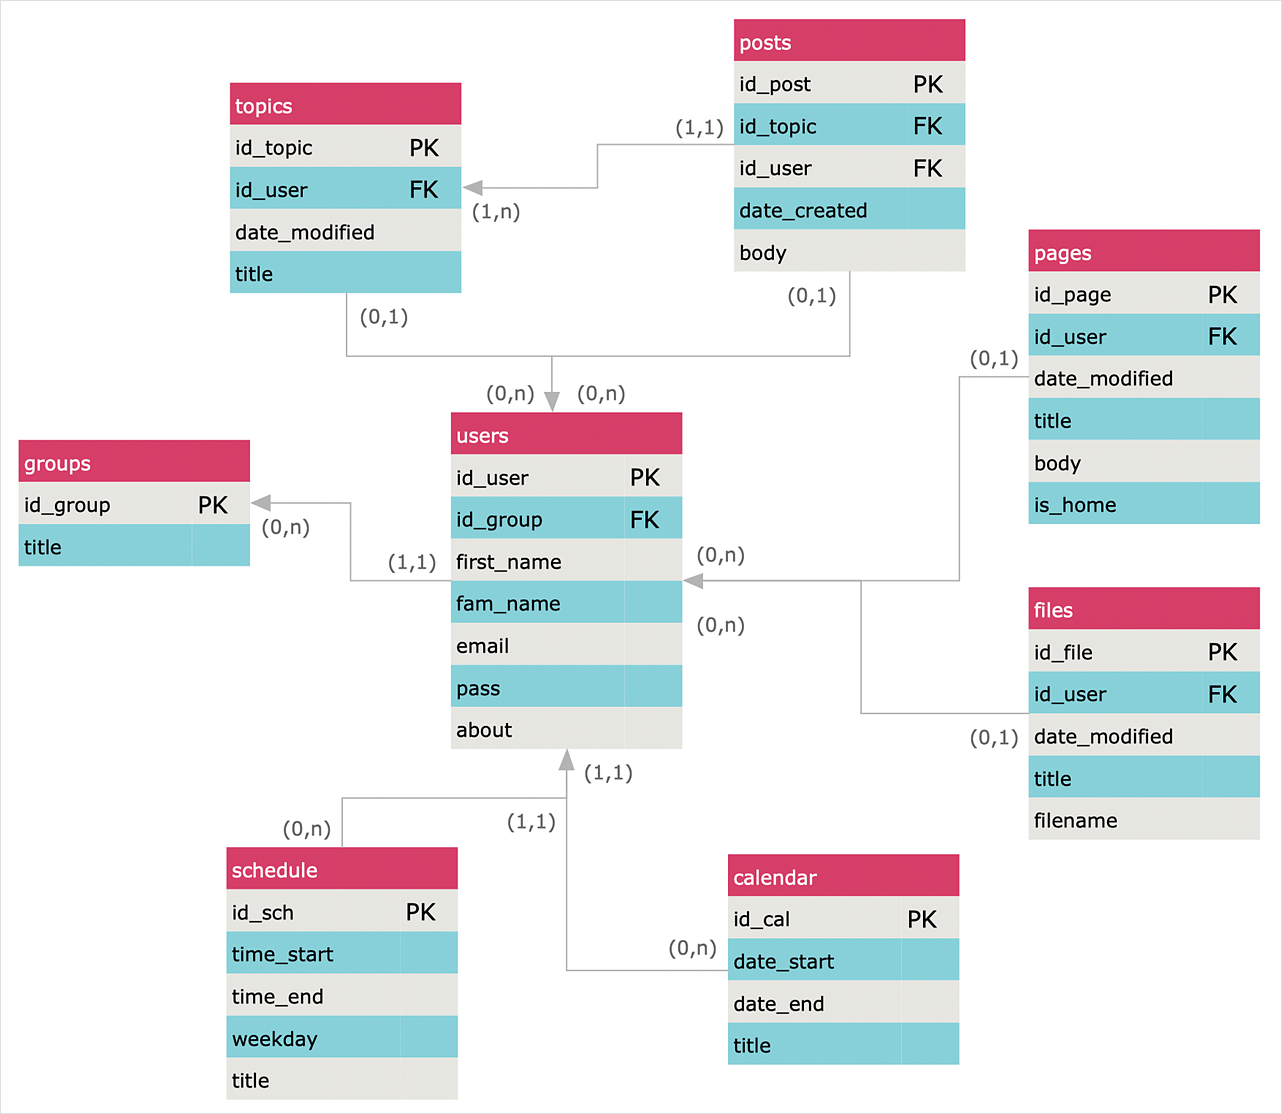
ERD (entity relationship diagram) is used to show the logical structure of databases. It represents the interrelationships between components of a database (entities). Entity relationship diagrams are widely used in software engineering. Using ERD software engineers can control every aspect of database development. ER diagram can be used as the guide for testing and communicating before the release of a software product. ERD displays data as entities that are connected with connections that show the relationships between entities. There are some ERD notations used by databases developers for representing the relationships between the data objects. ConceptDraw DIAGRAM and its ERD solution allow you to build ERD diagram of any notation.Network Visualization with ConceptDraw DIAGRAM
ConceptDraw makes the entire process of network visualization easier thanks to the numerous ready-to-use objects included in the package for presentation of network equipment, LDAP directory symbols and many other objects that symbolize resources in most various representations.Software development with ConceptDraw DIAGRAM
Modern software development requires creation of large amount of graphic documentation, these are the diagrams describing the work of applications in various notations and cuts, also GUI design and documentation on project management. ConceptDraw DIAGRAM technical and business graphics application possesses powerful tools for software development and designing technical documentation for object-oriented projects. Solutions included to the Software Development area of ConceptDraw Solution Park provide the specialists with possibility easily and quickly create graphic documentation. They deliver effective help in drawing thanks to the included package of templates, samples, examples, and libraries with numerous ready-to-use vector objects that allow easily design class hierarchies, object hierarchies, visual object-oriented designs, flowcharts, GUI designs, database designs, visualize the data with use of the most popular notations, including the UML and Booch notations, easy manage the development projects, automate projection and development.HelpDesk
How To Make Chen ER Diagram
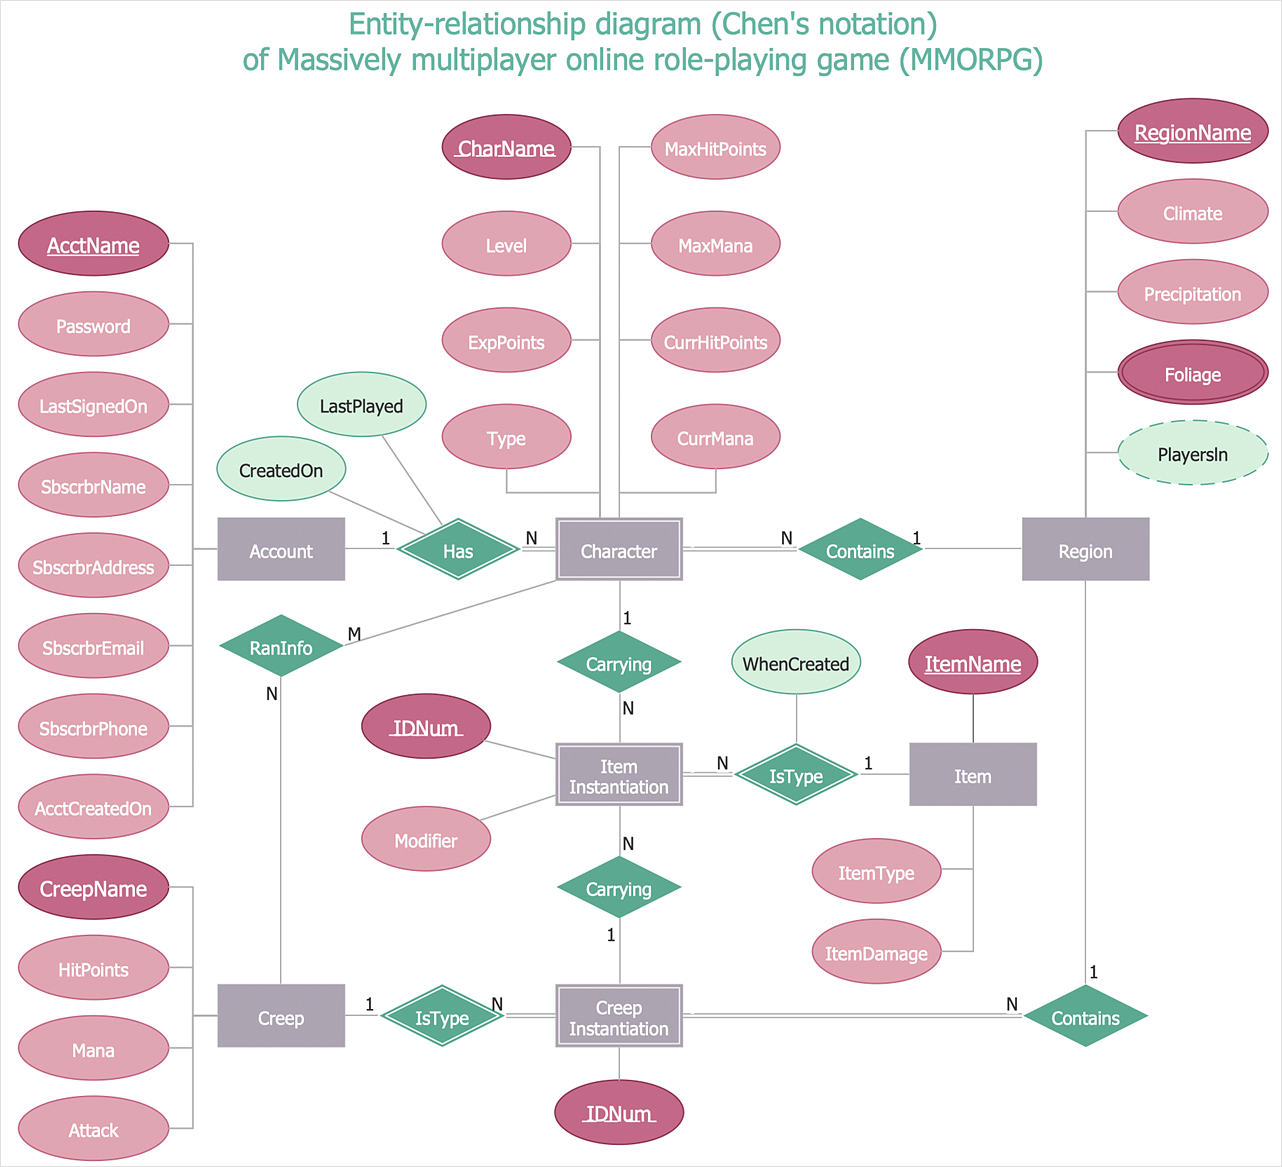
The Chen ERD notation model is a popular standard and is widely used worldwide in database and software design. The entity-relationship model proposed by Dr. Chen is constructed using a natural view of how the real world comprises entities and the relationships that exist with these identified entities. It was designed to leverage the advantages of the three entity-data models (network model, relationship model, entity model). The free Chen Notation solution for ConceptDraw DIAGRAM provides vector stencil libraries with full standardized Chen notation included.ER Diagram for Cloud Computing
The entity–relationship (ER) model is a data model that lets graphically represent the information system and depict the relationships between people, objects, concepts, places, and events within a given system. It is also convenient to use the ER Diagram for Cloud computing representation and description the Cloud computing architecture, design them with pleasure using the extensive tools of the Cloud Computing Diagrams solution from the Computers and Network area of ConceptDraw Solution Park.- Import Export Management System Er Diagram
- File Management System Erd
- Activity Diagram For Import Export Management System
- Block diagram - Document management system architecture | Block ...
- Import Export Management Project Flow Diagram
- Library Management System Documentation Pdf
- Er Diagram For Import Export Management Free Download Pdf
- Functional Block Diagram | Context Diagram Template | Process ...
- Entity-Relationship Diagram ( ERD ) | Process Flowchart | UML ...
- Components of ER Diagram


