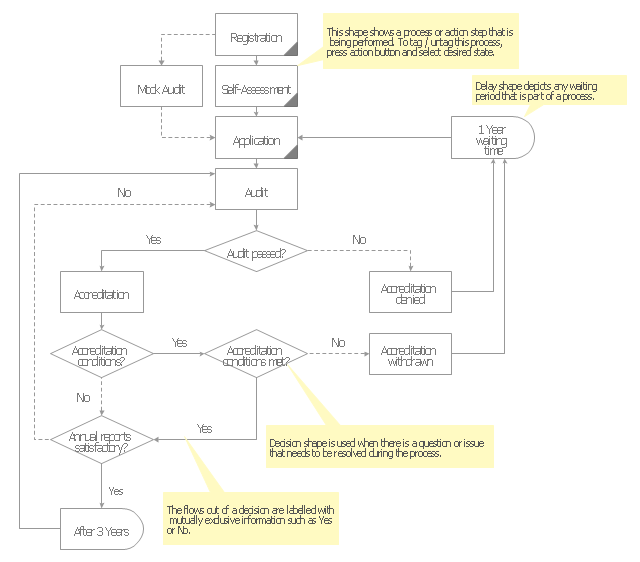
Audit flowcharts (audit diagrams) visualize business processes as financial transactions and inventory management. They are used to develop, analyse and present the audit processes.
"Auditing is a vital part of accounting. Traditionally, audits were mainly associated with gaining information about financial systems and the financial records of a company or a business.
Financial audits are performed to ascertain the validity and reliability of information, as well as to provide an assessment of a system's internal control. The goal of an audit is to express an opinion of the person / organization / system (etc.) in question, under evaluation based on work done on a test basis.
Due to constraints, an audit seeks to provide only reasonable assurance that the statements are free from material error. Hence, statistical sampling is often adopted in audits. In the case of financial audits, a set of financial statements are said to be true and fair when they are free of material misstatements – a concept influenced by both quantitative (numerical) and qualitative factors. But recently, the argument that auditing should go beyond just true and fair is gaining momentum. ...
Cost accounting is a process for verifying the cost of manufacturing or producing of any article, on the basis of accounts measuring the use of material, labor or other items of cost. In simple words, the term, cost audit means a systematic and accurate verification of the cost accounts and records, and checking for adherence to the cost accounting objectives. ...
An audit must adhere to generally accepted standards established by governing bodies. These standards assure third parties or external users that they can rely upon the auditor's opinion on the fairness of financial statements, or other subjects on which the auditor expresses an opinion." [Audit. Wikipedia]
The Audit flowchart template for the ConceptDraw PRO diagramming and vector drawing software is included in the Audit Flowcharts solution from the Finance and Accounting area of ConceptDraw Solution Park.
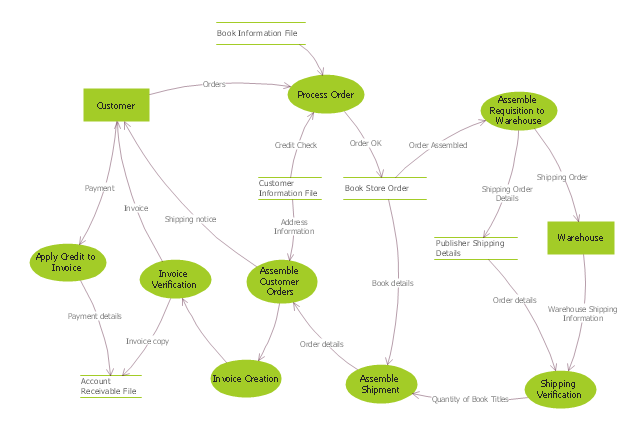
"Data flow diagrams are one of the three essential perspectives of the structured-systems analysis and design method SSADM. The sponsor of a project and the end users will need to be briefed and consulted throughout all stages of a system's evolution. With a data flow diagram, users are able to visualize how the system will operate, what the system will accomplish, and how the system will be implemented. The old system's dataflow diagrams can be drawn up and compared with the new system's data flow diagrams to draw comparisons to implement a more efficient system. Data flow diagrams can be used to provide the end user with a physical idea of where the data they input ultimately has an effect upon the structure of the whole system from order to dispatch to report. How any system is developed can be determined through a data flow diagram model.
In the course of developing a set of levelled data flow diagrams the analyst/ designers is forced to address how the system may be decomposed into component sub-systems, and to identify the transaction data in the data model.
Data flow diagrams can be used in both Analysis and Design phase of the SDLC.
There are different notations to draw data flow diagrams (Yourdon & Coad and Gane & Sarson), defining different visual representations for processes, data stores, data flow, and external entities." [Data flow diagram. Wikipedia]
The DFD (Yourdon and Coad notation) example "Process of account receivable" was created using the ConceptDraw PRO diagramming and vector drawing software extended with the Data Flow Diagrams solution from the Software Development area of ConceptDraw Solution Park.
In searching of alternative to MS Visio for MAC and PC with ConceptDraw DIAGRAM
Undoubtedly MS Visio is a powerful and multifunctional tool, but however at times occur the instances, when it turns unable of meeting certain users' requirements. At this cases you may need to use an alternative program software, preferably it will be simple, convenient, and at the same time powerful and professional. In searching the alternative to MS Visio for MAC and PC we recommend you to pay attention for ConceptDraw DIAGRAM software, which was developed to satisfy all your drawing needs and requirements. It is a fully-functioned alternative product to MS Visio for both platforms. ConceptDraw DIAGRAM software has many advantages, the main among them are the cross-platform compatibility, a reasonable price, widespread ConceptDraw Solution Park with huge variety of different solutions that offer numerous libraries of specialized vector objects, useful examples, samples, and quick-start templates, extensive import / export capabilities, built-in script language, MS Visio support and certainly free technical support.- Process Flowchart | Data Flow Diagram | How to Create Flowcharts ...
- Data Flow Diagram For Financial Accounting System
- Accounts Payable Data Flow Diagram
- Process Flow Diagram For Account
- Accounting Information Systems Flowchart Example
- Accounting Information Systems Flowchart Symbols | How to Create ...
- Invoice payment process - Flowchart | Accounting Flowchart ...
- How to Create Flowcharts for an Accounting Information System ...
- Data Flow Diagram Process | DFD - Process of account receivable ...
- Example Of Accounting Information Systems Flowchart
- Accounting Flowchart Symbols | Basic Flowchart Symbols and ...
- Process Flowchart | How to Create Flowcharts for an Accounting ...
- Basic Flowchart Symbols and Meaning | Accounting Flowchart ...
- Basic Flowchart Symbols and Meaning | Accounting Information ...
- How Do You Make An Accounting Process Flowchart ? | Accounting ...
- DFD Library System | Process Flowchart | Data Flow Diagram ...
- Accounting Flowchart Symbols | Accounting Information Systems ...
- Accounting Flowchart Symbols | Basic Flowchart Symbols and ...
- Accounting Information Systems Flowchart Symbols | How to Create ...
- Process Flowchart | How to Create Flowcharts for an Accounting ...


