Network Diagram Software ISG Network Diagram
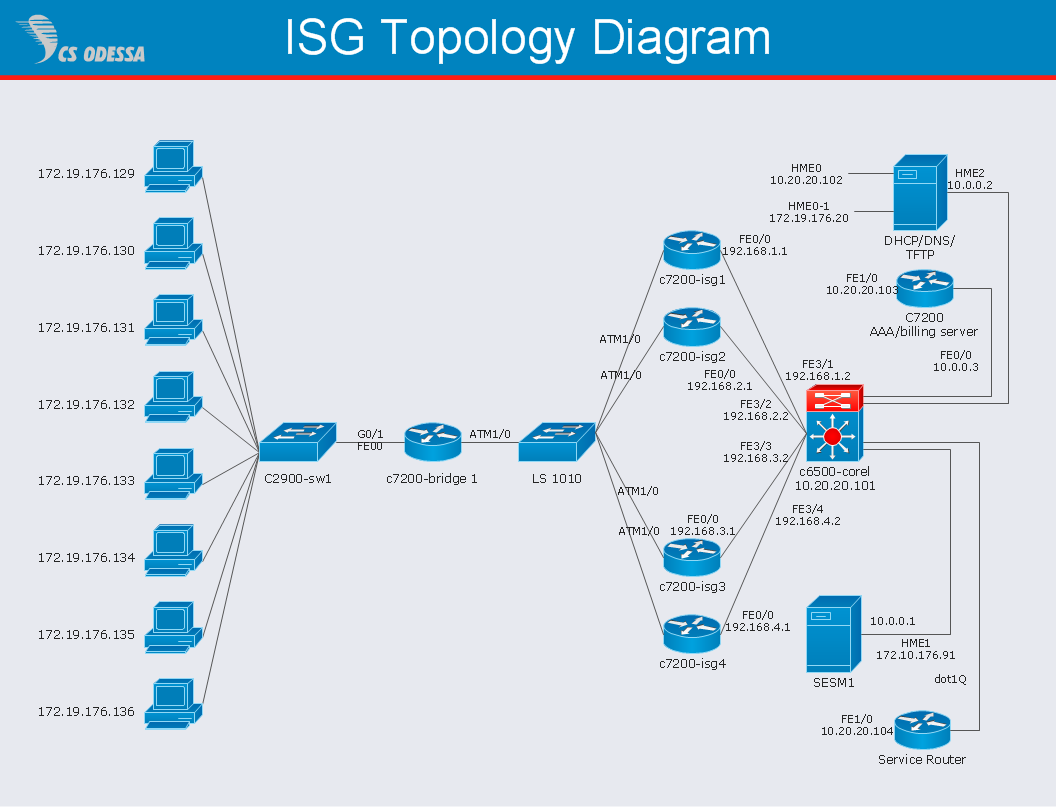
Drawing ISG Network Diagram using ConceptDraw DIAGRAM stencils
Network Diagram Software
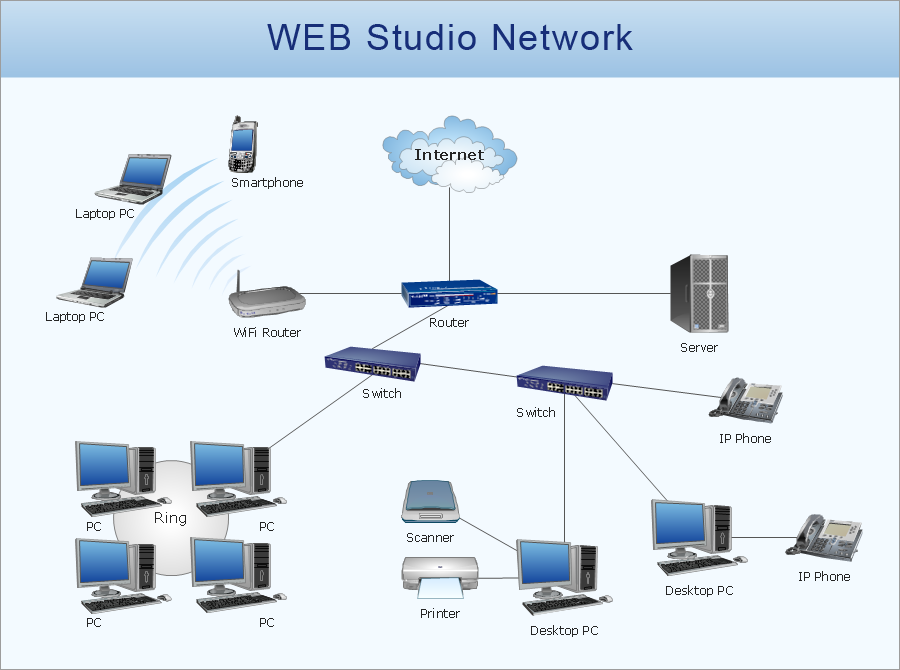
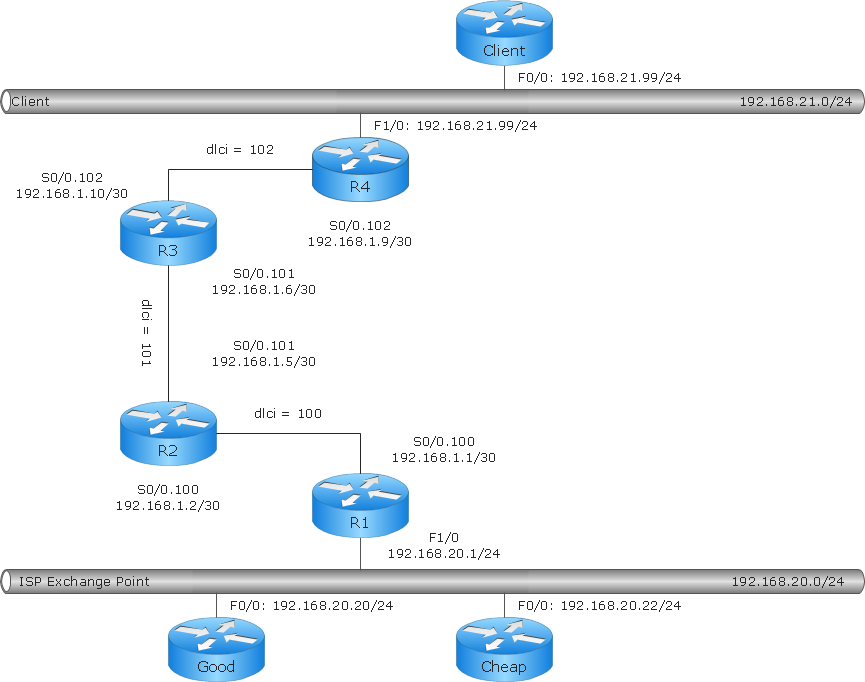
Network Diagrams are used to visually represent the network architecture, to illustrate the network structure, how the computers and other elements of the network are connected each other using a variety of network symbols, clipart and connection lines. They are incredibly useful on the stages of projecting computer network, of its construction and exploitation. Professionally designed and accurate Network Diagrams are equally convenient for computer engineers and users. You can construct them by hand on the paper or use special network diagramming software, such as ConceptDraw DIAGRAM. Having at disposal the powerful network diagramming tools of Computer Network Diagrams solution included to ConceptDraw Solution Park, you can succeed in drawing various types of Computer Network Diagrams, among them Network Communication Plans, Logical Network Diagrams, Network Topology Diagrams, LAN and WAN Diagrams, Network Floor Plan Layouts, Computer Network System Diagrams, Web-based Network Diagrams, Wireless Network Diagrams, Cisco Network Diagram, and others.
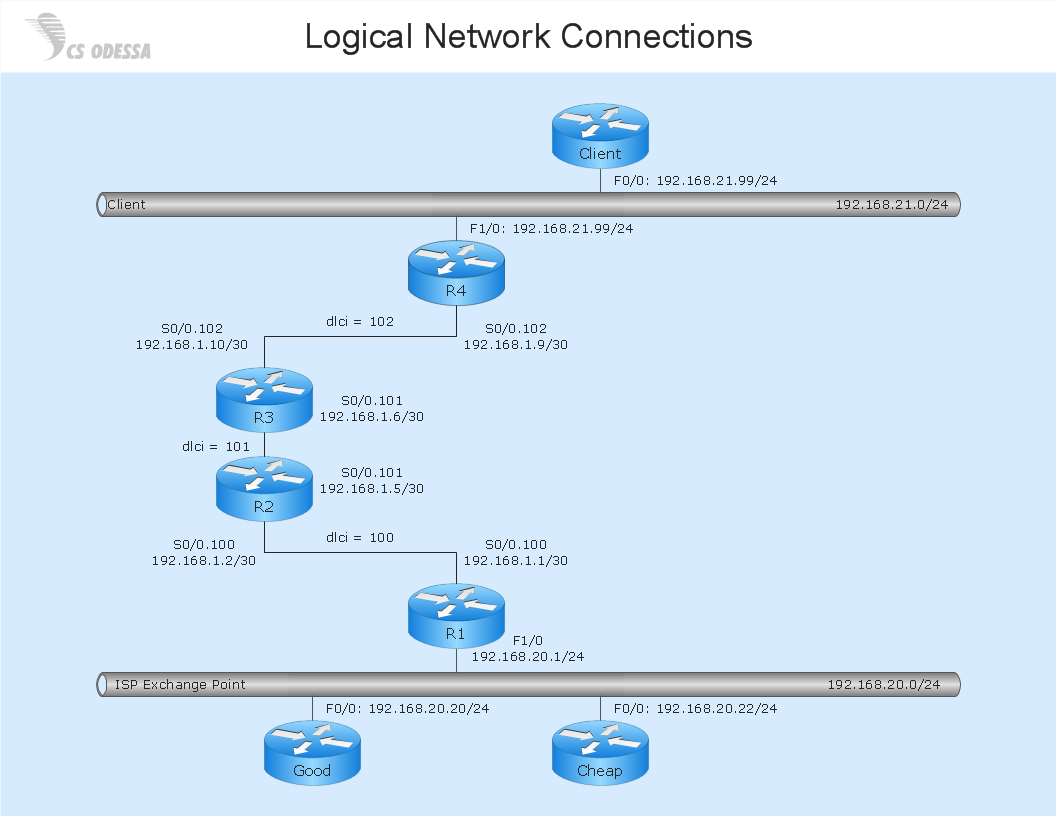
Network Diagram Software Logical Network Diagram
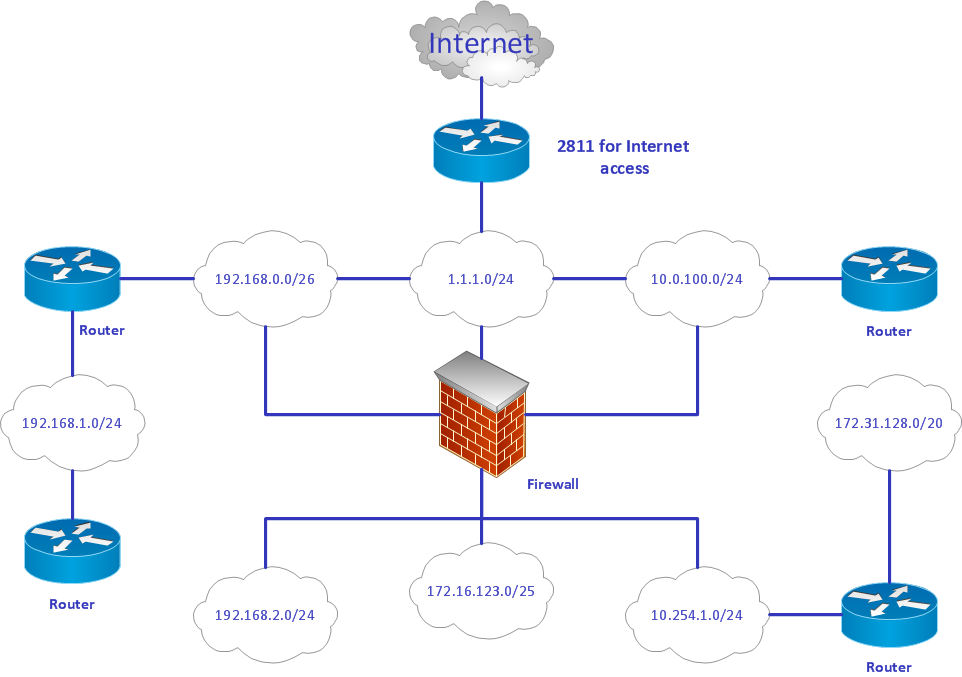
Perfect Network Diagramming Software with examples of LAN Diagrams. ConceptDraw Network Diagram is ideal for network engineers and network designers who need to draw Logical Network diagrams.
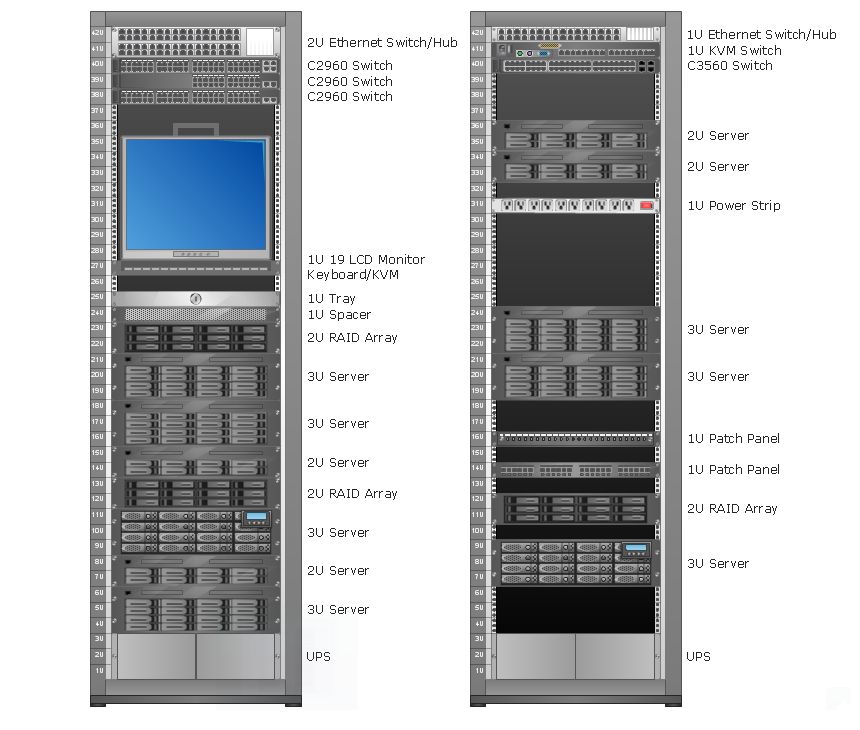
Rack Diagrams
Rack Diagrams visualize the rack mounting of computer and network equipment as the drawing of frontal view of the rack with equipment installed. They are used for choosing the equipment or racks to buy, and help to organize equipment on the racks virtually, without the real installation.
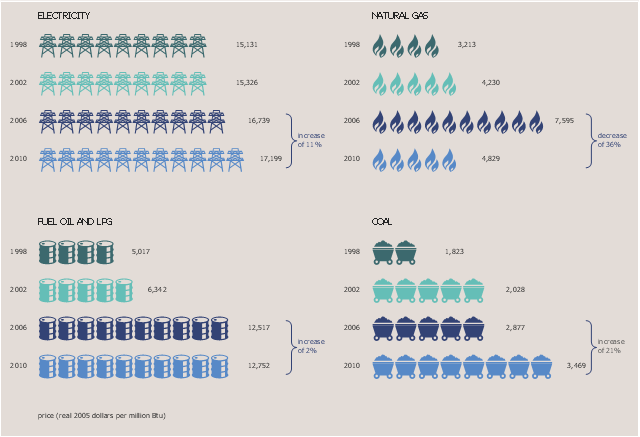
This picture bar graphs sample shows the average energy prices for manufacturers (1998-2010). It was designed on the base of data of the article "Cost of Natural Gas Used in Manufacturing Sector Has Fallen" from the website of the U.S. Energy Information Administration (EIA). [eia.gov/ consumption/ manufacturing/ reports/ 2010/ ng_ cost/ ?src=%E2%80%B9%20 Consumption%20 %20 %20 %20 %20 %20 Manufacturing%20 Energy%20 Consumption%20 Survey%20 (MECS)-f1]
The pictorial charts example "Average energy prices for manufacturers" was created using the ConceptDraw PRO diagramming and vector drawing software extended with the Picture Graphs solution from the Graphs and Charts area of ConceptDraw Solution Park.
The pictorial charts example "Average energy prices for manufacturers" was created using the ConceptDraw PRO diagramming and vector drawing software extended with the Picture Graphs solution from the Graphs and Charts area of ConceptDraw Solution Park.
Used Solutions
 Ice Hockey
The Ice Hockey Solution extends the capabilities of ConceptDraw DIAGRAM.5 (or later) with samples, templates, and libraries of vector objects for drawing hockey diagrams, plays schemas, and illustrations. The Ice Hockey Solution can be used to make polishe
Produce Professional Diagrams More Quickly, Easily and Cost Effectively
ConceptDraw Arrows10 Technology - This is more than enough versatility to produce professional diagrams more quickly. Professional diagramming software for mac helps you create variety diagrams, graphics, charts, live dashboards and plenty of graphics and pictures for your business and study.New Connectors Technology
ConceptDraw DIAGRAM is a cross-platform flowcharting tool with extended HTML capabilities. It contains more than 10 000 pre-created objects and many templates, available for PC and Macintosh. Creating great designs and diagrams involves having the right drawing software. ConceptDraw new connectors called Arrows10 Technology is more than enough versatility to draw any type of diagram with any degree of complexity. ConceptDraw is the business diagram software of choice for business professionals who need to quickly and easily visualize, explore, and communicate information.- Hand Tools Png
- Stations - Vector stencils library | American football positions - Vector ...
- Basketball Plays Software | Offensive Play – Double Wing Wedge ...
- Stations - Vector stencils library | Electrical Symbols, Electrical ...
- Radio networks. Computer and Network Examples | Initiation and ...
- Design elements - Android system icons (toggle) | Toolbar control ...
- Keyboard Shortcuts and Mouse Actions | Mouse & Clicks | Computer ...
- Electrical Symbols, Electrical Diagram Symbols | Electrical Symbols ...
- Illustration | CORRECTIVE ACTIONS PLANNING. Involvement ...
- Total value of manufacturers' shipments | Average energy prices for ...
- Ice Hockey Rink Png
- Keyboard Shortcuts and Mouse Actions | Mac OS X Lion buttons and ...
- Ice sledge hockey - Winter sports pictograms | Winter Sports | Sochi ...
- Concept Maps | Bubble diagrams with ConceptDraw PRO | E-Filing ...
- Logical network topology diagram | Local area network (LAN ...
- Local area network (LAN). Computer and Network Examples ...
- Ice Hockey Positions Diagram
- Basic Flowchart Symbols and Meaning | Venn Diagram Examples ...
- Ice Hockey Diagram – Defensive Strategy – Neutral Zone Trap ...
- Rack Diagrams | Network Diagramming Software for Design Rack ...
