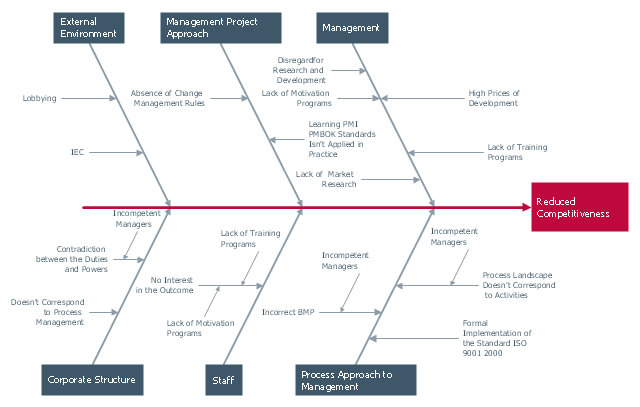
"Cause-and-effect diagrams can reveal key relationships among various variables, and the possible causes provide additional insight into process behavior.
Causes can be derived from brainstorming sessions. These groups can then be labeled as categories of the fishbone. They will typically be one of the traditional categories mentioned above but may be something unique to the application in a specific case. Causes can be traced back to root causes with the 5 Whys technique." [Ishikawa diagram. Wikipedia]
The Ishikawa diagram (cause and effect diagram, fishbone diagram) example "Factors reducing competitiveness" was created using the ConceptDraw PRO diagramming and vector drawing software extended with the Fishbone Diagrams solution from the Management area of ConceptDraw Solution Park.
 Fishbone Diagram
Fishbone Diagrams solution extends ConceptDraw PRO software with templates, samples and library of vector stencils for drawing the Ishikawa diagrams for cause and effect analysis.
 Fishbone Diagrams
The Fishbone Diagrams solution extends ConceptDraw PRO v10 software with the ability to easily draw the Fishbone Diagrams (Ishikawa Diagrams) to clearly see the cause and effect analysis and also problem solving. The vector graphic diagrams produced using this solution can be used in whitepapers, presentations, datasheets, posters, and published technical material.
- Fishbone diagram - Template | Ishikawa diagram - Factors reducing ...
- Food infogram - Reducing sodium | Ishikawa diagram - Factors ...
- Explanation Of Reducing Competitiveness By Fish Bone Dagram
- Draw Fishbone Diagram on MAC Software | Fishbone Diagram ...
- Competitor Analysis | Ishikawa Diagram | Cause and Effect Diagram ...
- Ishikawa Diagram | Draw Fishbone Diagram on MAC Software ...
- Ishikawa Diagram | Fishbone Diagram Example | Ishikawa fishbone ...
- Ishikawa Diagram | Manufacturing 8 Ms fishbone diagram ...
- Example Of Factors Diagram
- Ishikawa Diagram | How To Convert a Fishbone Diagram to Adobe ...
- Design elements - Cause-and-effect diagram | Fishbone diagram ...
- Fishbone diagram - Causes of low-quality output | Process ...
- Total Quality Management with ConceptDraw | Fishbone diagram ...
- Draw Fishbone Diagram on MAC Software | Fishbone Diagram ...
- Ishikawa Diagram | Fishbone Diagram Template | Draw Fishbone ...
- Fishbone Diagram | Fishbone Diagrams | Total Quality Management ...
- How to Construct a Fishbone Diagram | Total Quality Management ...
- Cause And Effect Diagram In Tqm
- Cause and Effect Analysis | Cause and Effect Diagram | PROBLEM ...
