 Family Tree
Family Tree solution with included vector design shapes for drawing family trees, pedigree chart symbols, photo blocks of different detailing and professionally designed samples, extends the functionality of ConceptDraw DIAGRAM software making it the best family tree maker and easy-to-use ancestry trees designer program for researchers, scientists, historians, genetics, medics, archeologists, and other stakeholders. Use it to design informative and colorful genealogy trees, simple family tree or extensive ancestry tree of any depth, genealogy schematics and illustrations with family trees.
 Genogram
Genogram solution including professionally designed genogram samples and a wide range of high-quality vector design elements of genogram symbols, medical genogram symbols, emotional relationships and family relationships, makes the ConceptDraw DIAGRAM software the best for drawing the informative Genograms, genealogy schematics and illustrations, and family tree of any depth, and for any quantity of generations. It perfectly suits for the medical specialists of different profiles, medical consultants, therapists, genetics, psychologists, and other medical professionals, each individual and couple.
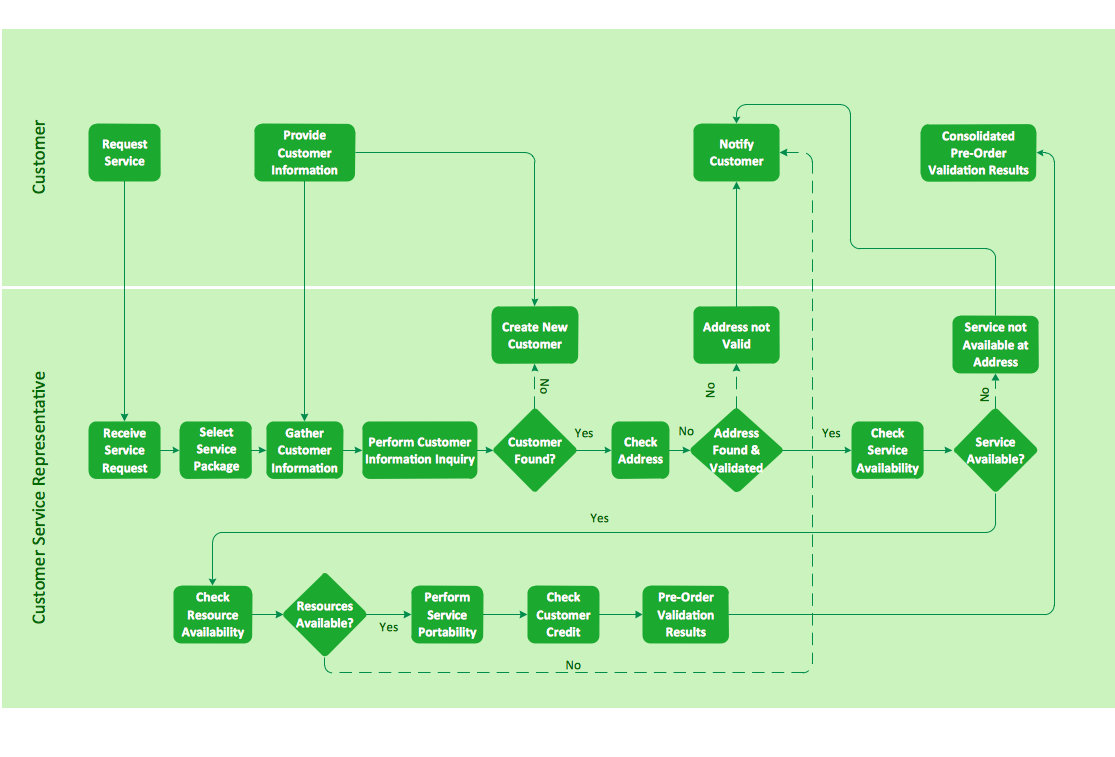
Cross-functional flowchart landscape, U.S. units
In Cross-Functional Flowchart first step is to determine how many lanes you want to represent and what the lane titles will be. The choice of vertical or horizontal swim lanes landscape comes down to personal choice or just plain “what fits best”. With ConceptDraw, we make that simple by including different swim lanes templates. Professional looking examples and templates of Swimlane Flowchart which help you create Cross Functional Flowcharts rapidly.Express-G Diagram
The vector stencils library from the solution Information Model Diagrams contains specific data type symbols of the EXPRESS-G notation such as entity data type symbols, simple data type symbols, enumeration data type symbols, defined data type symbols, select data type symbols and specific attribute symbols for ConceptDraw DIAGRAM diagramming and vector drawing software. The Information Model Diagrams solution is contained in the Software Development area of ConceptDraw Solution Park.
 Health Package
Health Package is a set of multifaceted solutions intended for visualization and illustration in a field of medicine and health, for drawing colorful, interesting and precise illustrations and infographics that will be used successfully in medical documents, articles, special magazines, posters, billboards, websites, presentations, collages. Having these solutions available, it will not be difficult to illustrate the medical editions, to convey the information in a full and interesting form, to teach students with use effective visual methods, to describe the medical facts, to tell about innovations in a field of medicine, health and correct nutrition, to explain the causes and consequences of different diseases, as well as the measures of their prevention and treatment.
IDEF0 Flowchart Symbols
The modeling of business and business processes is not quite a simple process for both small-size businesses and large businesses. The IDEF0 method is one of the popular and easy methods of modeling the business as a complex system. It is based on the functional modeling language Structured Analysis and Design Technique (abbr. SADT) and is concentrated on the activity modeling. According to this method are constructed the IDEF0 Diagrams and IDEF0 Flowcharts, which are succesfully used not only for documenting the business, but also for analysis, development, integration of information and software systems, reengineering, etc. This method suggests the use of special IDEF0 Flowchart Symbols from the IDEF0 notation for construction the IDEF0 Flowcharts. ConceptDraw DIAGRAM diagramming and vector graphic software extended with IDEF0 Diagrams solution from the Software Development area of ConceptDraw Solution Park is rich for the powerful drawing tools, built-in templates and samples, and predesigned IDEF0 flowchart symbols.Visio Files and ConceptDraw
Visio Files and ConceptDraw. ConceptDraw DIAGRAM is compatible with MS Visio.VDX formatted files.VDX is Visio’s open XML file format, and it can be easily imported and exported by ConceptDraw DIAGRAM.Multi Layer Venn Diagram. Venn Diagram Example
To visualize the relationships between subsets of the universal set you can use Venn diagrams. To construct one, you should divide the plane into a number of cells using n figures. Each figure in the chart represents a single set of, and n is the number of represented sets. Splitting is done in a way that there is one and only one cell for any set of these figures, the points of which belong to all the figures from the set and do not belong to others. The plane on which the figures are represented, is the universal set U. Thus, the point which does not belong to any of the figures, belongs only to U.Types of Flowcharts
A Flowchart is a graphical representation of process, algorithm, workflow or step-by-step solution of the problem. It shows the steps as boxes of various kinds and connects them by arrows in a defined order depicting a flow. There are twelve main Flowchart types: Basic Flowchart, Business Process Modeling Diagram (BPMN), Cross Functional Flowchart, Data Flow Diagram (DFD), IDEF (Integrated DEFinition) Flowchart, Event-driven Process Chain (EPC) Diagram, Influence Diagram (ID), Swimlane Flowchart, Process Flow Diagram (PFD), Specification and Description Language (SDL) Diagram, Value Stream Mapping, Workflow Diagram. Using the Flowcharts solution from the Diagrams area of ConceptDraw Solution Park you can easy and quickly design a Flowchart of any of these types. This solution offers a lot of special predesigned vector symbols for each of these widely used notations. They will make the drawing process of Flowcharts much easier than ever. Pay also attention for the included collection of ready Flowchart examples, samples and quick-start templates. This is business process improvement tools. If you are looking for MS Visio for your Mac, then you are out of luck, because it hasn't been released yet. However, you can use Visio alternatives that can successfully replace its functions. ConceptDraw DIAGRAM is an alternative to MS Visio for Mac that provides powerful features and intuitive user interface for the same.
Integration Definition
Creation of various types of Integration DEFinition (IDEF) diagrams - IDEF0, IDEF1X, IDEF2, IDEF3 and many other is a sufficiently complex process that requires powerful automated tools. ConceptDraw DIAGRAM diagramming and vector drawing software offers you such tool - IDEF Business Process Diagrams solution from the Business Processes area of ConceptDraw Solution Park.What Is a Circle Spoke Diagram
What Is a Circle Spoke Diagram? It is a diagram which have a central item surrounded by other items in a circle. The Circle Spoke Diagrams are often used to show the features or components of the central item in marketing and management documents and presentations. ConceptDraw DIAGRAM extended with Circle-Spoke Diagrams Solution from the "Diagrams" Area is the best software for creating Circle-Spoke Diagrams.
 Entity-Relationship Diagram (ERD)
An Entity-Relationship Diagram (ERD) is a visual presentation of entities and relationships. That type of diagrams is often used in the semi-structured or unstructured data in databases and information systems. At first glance ERD is similar to a flowch
Circle Diagrams
The Circle Diagrams are the diagrams which represent the central element surrounded by other items in a circle. This type of diagram is very popular and widely used in marketing and management, for process modeling, market, resource, time and cost analysis, for visualization causes and effects. If you dream to design the Circle Diagrams quick and easy – the ConceptDraw DIAGRAM software extended with Circle-Spoke Diagrams Solution from the "Diagrams" Area is exactly what you need.ER Diagram Programs for Mac
ConceptDraw DIAGRAM compatible Mac OS X software extended with powerful Entity-Relationship Diagram (ERD) Solution from the Software Development Area for ConceptDraw Solution Park is one of the famous ER Diagram Programs for Mac. It gives the perfect ability to draw ER diagrams for visually describing databases with Chen's and Crow's Foot notation icons.Risk Diagram (Process Decision Program Chart)
The risk is a probable event in result of which may occur the negative events and adverse consequences. The risk management is a very important process in any field, it is a process of making the management decisions aimed on the reducing the likelihood of appearing the unfavorable results and on the minimizing potential losses, as well as the implementation of these solutions. The main purpose of applying the risk management is increasing of enterprise's competitiveness with help of protection against the risks. ConceptDraw MINDMAP software is perfect for identifying the risks, analyzing and managing risks, for designing Risk Diagrams, for developing effective actions in response to circumstances and potential obstacles that were identified as risks. It is also the best for designing Process Decision Program Charts and representing the PDPC method, which is effective way of detailed planning and depiction the whole sequence of actions on the path from the formulation a problem to its solution. The PDPC lets determine the risks when corrective actions are not performed correctly and helps develop descriptions for preventive actions.
 Data Flow Diagrams (DFD)
Data Flow Diagrams solution extends ConceptDraw DIAGRAM software with templates, samples and libraries of vector stencils for drawing the data flow diagrams (DFD).
Flowchart Software
Flowchart is a simple diagram, map or graphical schematic representation the sequence of actions within a process. It is ideal for displaying how a process currently flows or can function ideally. The Flowcharts let define the steps and boundaries of a process, uncover problems or miscommunications. The Flowcharts are widely used in education, software development, business, economics, thanks to their visuality they are ideal for presentations, reports, for using on conferences to help the audience comprehend the content better, or easy find flaws in a process flow diagrams. ConceptDraw DIAGRAM is professional flowcharts software and feature-rich flowchart maker, which supports Mac OS X and Windows. It contains at ConceptDraw Solution Park a rich set of stencils and professional flowchart symbols for design. It lets create simply professional-looking Flowcharts based on thousand free flowchart templates, colored symbols and examples. ConceptDraw DIAGRAM is a 3 times cheaper alternative to MS Visio available for both Mac and PC. It’s is another full featured business and technical diagramming application that can easily take care of Visio files within OS X. Another bonus with ConceptDraw DIAGRAM – it's cross-platform. You can work on a document in both OS X and Windows, skipping Visio entirely.
ER Diagram Styles
When creating ER diagrams, you can apply different color ER diagram styles and also notation styles. ConceptDraw DIAGRAM enhanced with Entity-Relationship Diagram (ERD) Solution gives the ability to draw visual and attractive ER Diagrams using the style icons from Crow’s Foot notation and Chen's notation professionally designed and offered by ERD Chen's Notation and ERD Crow’s Foot Notation libraries.Evernote exchange - Personal Productivity
All information you send from ConceptDraw MINDMAP is indexed for you by Evernote, making information easy to find and use.- Block Diagrams | Express-G Diagram | ER Diagram Styles | Family ...
- Block Diagrams | Decision Making | Family Emergency Plan | How ...
- Army Flow Charts | Flow Chat On Joint Family
- Express-G Diagram | Block Diagrams | ER Diagram Programs for ...
- The Best Flowchart Software Available | Express-G Diagram | Family ...
- ER Diagram Styles | Entity- Relationship Diagram (ERD) with ...
- The Best Flowchart Software Available | Block Diagrams | Family ...
- The Best Flowchart Software Available | Block Diagrams | Family ...
- Family Emergency Plan | Tools to Create Your Own Infographics ...
- Block Diagrams | Decision Making | The Best Flowchart Software ...
- Block Diagrams | Family Emergency Plan | Fault Tree Analysis ...
- Free Family Tree Charts
- Entity Relationship Diagrams Showing Family Tree
- Er Diagram Of Family
- Block Diagrams | Cause and Effect Analysis | Express-G Diagram ...
- The Best Flowchart Software Available | Entity- Relationship Diagram ...
- Family Tree | Flowchart of Products. Flowchart Examples | Safety ...
- Family Relation Icon Png
- Family Emergency Plan | The Best Flowchart Software Available ...
- The Best Flowchart Software Available | Family Emergency Plan ...


